On clicking the Key Indicators option on the Today screen a form similar to the following will be displayed.
Selecting any of the options listed will display any of the details for that category on the main grid to the right of this list.
This facility permits the user to view the success rate for enquiries raised within the specified number of days as chosen by the user in the Period: Last X Days field at the bottom of this screen and not the Due No Days option on the main form.
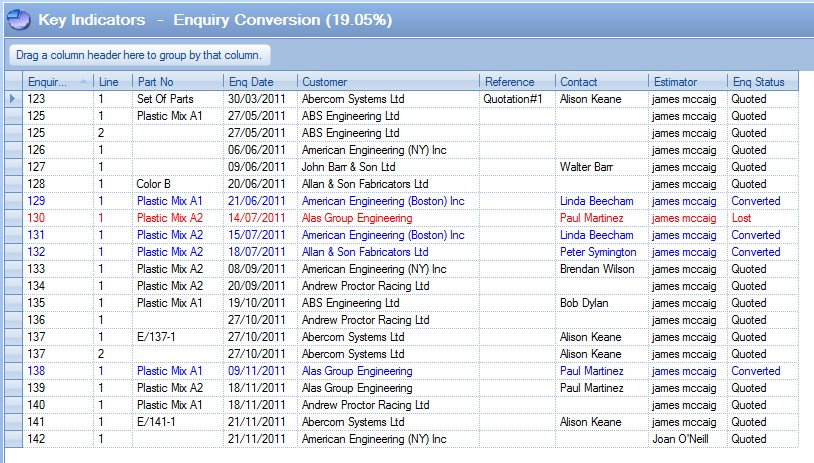
The number of enquiries raised within the selected time period will be displayed along with the corresponding success rate (% converted) and failure rate (% lost) for the number of days selected.
![]()
Enquiry line items are displayed in 3 different colours: - blue for items that have been converted to sales orders, red for items that have had their enquiry status marked as lost and black for currently outstanding items.
To view all the information contained for an enquiry the user may simply ‘double click’ on the required line. A screen similar to the following will be displayed.
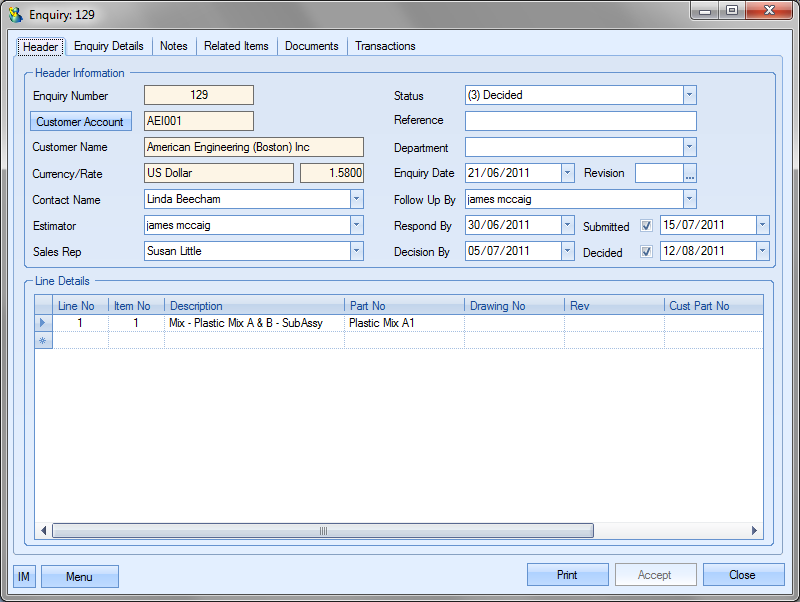
The user may if required change certain information contained on this enquiry if he or she has permission to do so as determined within the User Access Rights section of the Security section of Progress. For more information on amending enquiries please refer to the Enquiry section of this manual.
Clicking either the Accept or Cancel button will return the user to the Today screen.
Clicking the Graph option at the bottom of the screen generates a graphical representation of the of the enquiry conversion figures.
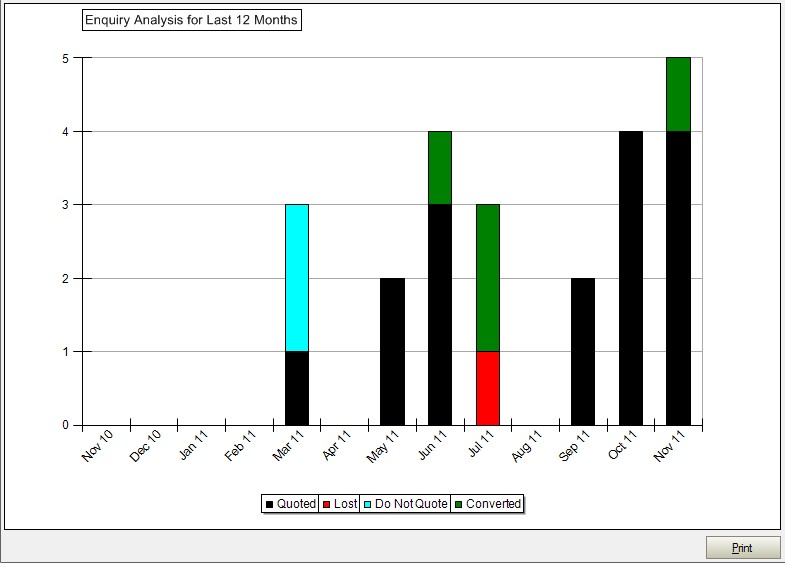
The Print option allows the user to print a hard copy of the graph.
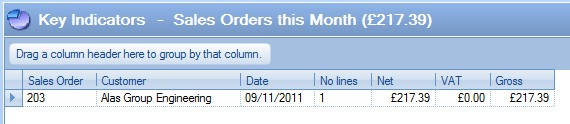
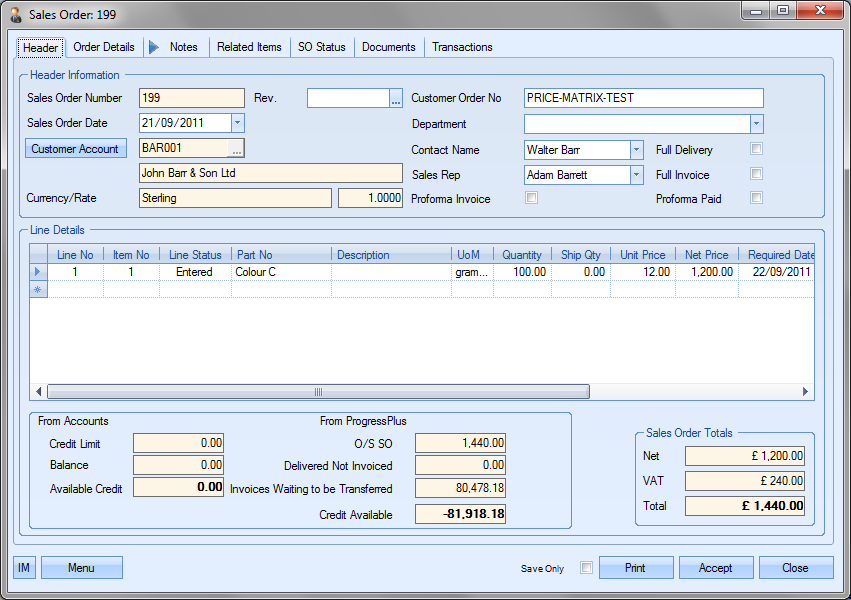
This option displays sales orders that have been entered in the current calendar month. This is a complete list of all these items and does not take into account any figure selected in the Due No of Days option. The total value of these lines is also displayed.
To view all the information contained for a sales order the user may simply ‘double click’ on the required line. A screen similar to the following will be displayed.
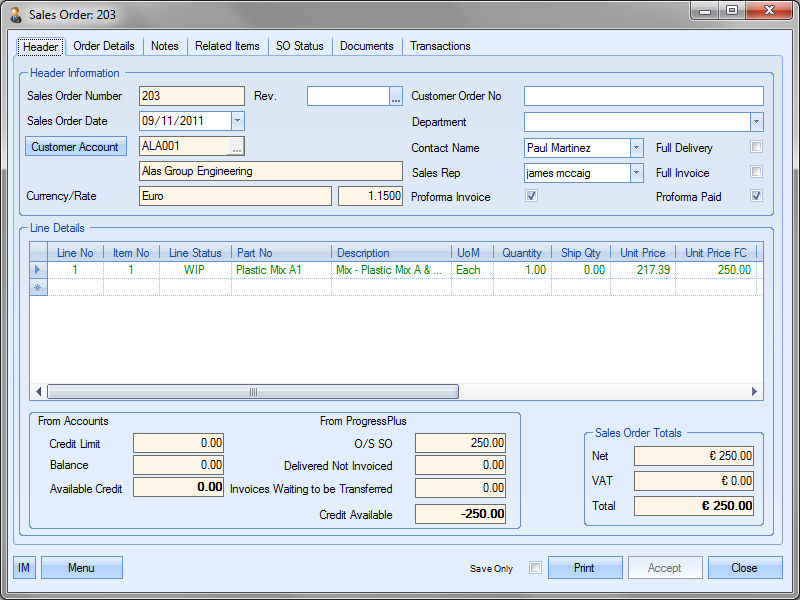
The user may if required change certain information contained on this enquiry if he or she has permission to do so as determined within the User Access Rights section of the Security section of Progress. For more information on amending enquiries please refer to the Sales Order section of this manual.
Clicking either the Accept or Cancel button will return the user to the Today screen.
Clicking the Graph option at the bottom of the screen generates a graphical representation of the sales orders raised over the last 12 months.
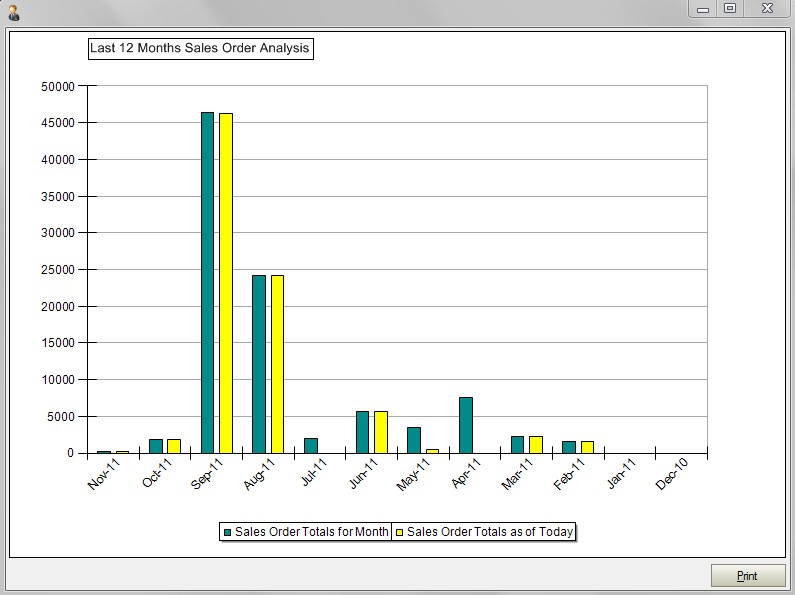
This graph also displays the corresponding position regarding sales orders entered at this day for the previous eleven months i.e. if the current date is the 24th this graph will show the value of sales orders raised by the 24th on the last previous eleven months. A hard copy can be printed off to the default printer using the Print button.
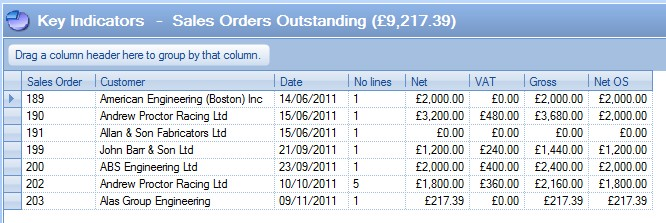
This option displays all outstanding sales. This is a complete list of all these items and does not take into account any figure selected in the Due No of Days option. The total value of these lines is also displayed.
To view all the information contained for a sales order the user may simply ‘double click’ on the required line. A screen similar to the following will be displayed.
The user may if required change certain information contained on this enquiry if he or she has permission to do so as determined within the User Access Rights section of the Security section of Progress. For more information on amending enquiries please refer to the Sales Order section of this manual.
Clicking either the Accept or Close button will return the user to the Today screen.
Clicking the Graph option at the bottom of the screen generates a graphical representation of the sales orders raised over the last 12 months.

This graph also displays the corresponding position regarding sales orders entered at this day for the previous eleven months i.e. if the current date is the 24th this graph will show the value of sales orders raised by the 24th on the last previous eleven months. A hard copy can be printed off to the default printer using the Print button.
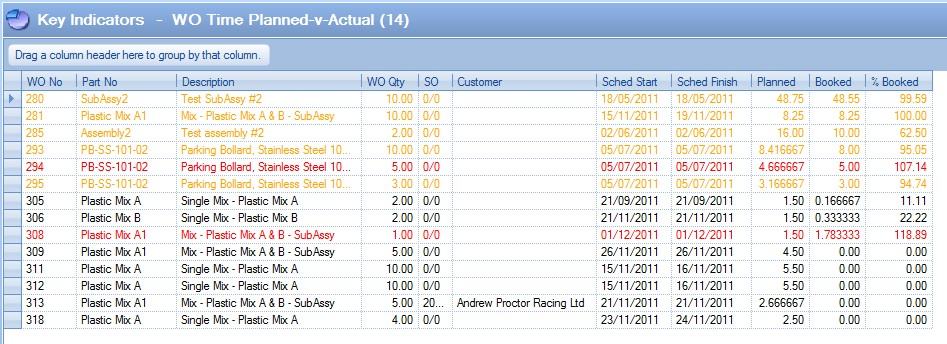
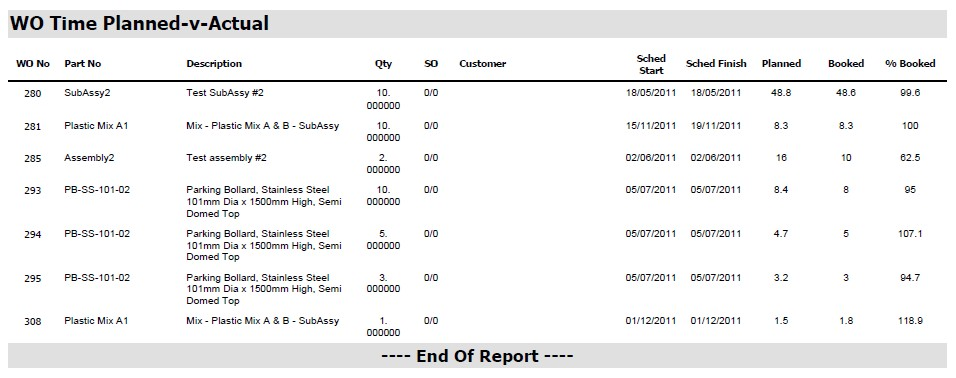
This option displays all active WOs with the planned and actual total operation times as well as a percentage reflecting how much of the planned time has been completed so far. By default, the system shows only WOs where the Planned Time % is equal to, or has exceeded, 100%.
Where a WO has exceeded the total planned time, the WO entry is shown in red. If the WO has exceeded the planned % set at the bottom of the screen, but has not yet exceeded the total planned time, the WO entry is shown in orange.
The options at the bottom of the screen allow the user to set the % required as well as give the user the option of seeing any WOs where the planned % figure is less than the level specified.
![]()
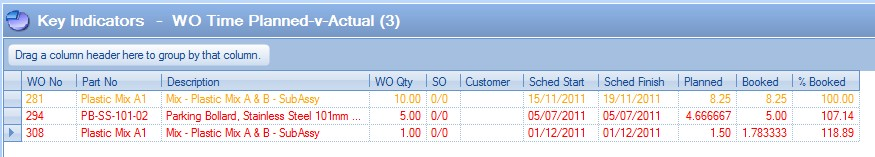
For example, setting the Planned Time % to 50% and ticking the box to show all WOs that are below 50% also presents the following details on screen.
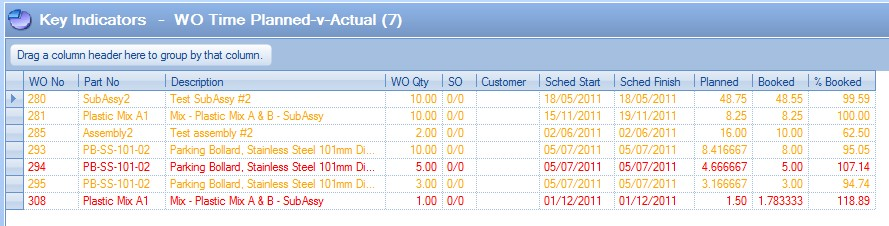
Removing the WOs less than the Planned Time % (unticking the option) will reduce this to the following details.
To view all the information contained for a works order the user may simply ‘double click’ on the required line. A screen similar to the following will be displayed.
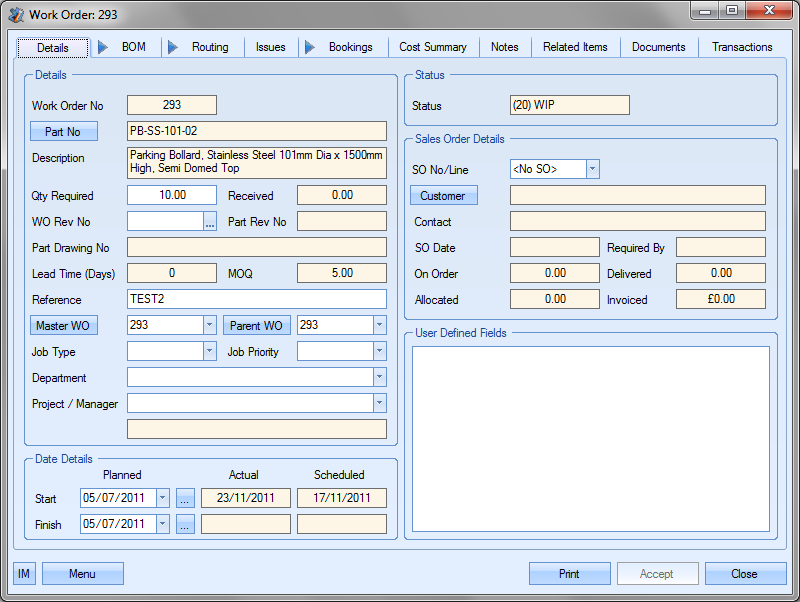
The user may if required change certain information contained on this enquiry if he or she has permission to do so as determined within the User Access Rights section of the Security section of Progress. For more information on amending enquiries please refer to the Works Order section of this manual.
Clicking either the Accept or Close button will return the user to the Today screen.
The Print button on the bottom of the screen permits the users to print off a hard copy of the information regarding the Planned Vs Actual operation times.
WO With All Material Available To Issue
This option displays all WOs with sufficient component inventory to manufacture at least one complete finished unit.
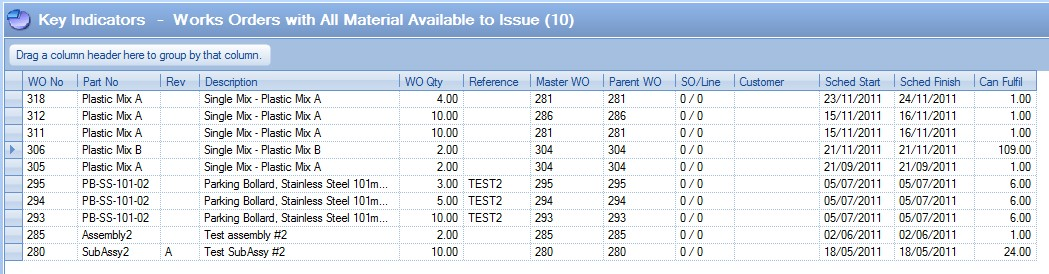
The user has an option at the bottom of the screen to limit this screen to only see WOs where there is sufficient component inventory to complete the full WO requirements quantity.
![]()
If this option is ticked, the above information will be reduced to only show WOs where the complete WO quantity can be fully completed.
To view all the information contained for a works order the user may simply ‘double click’ on the required line. A screen similar to the following will be displayed.
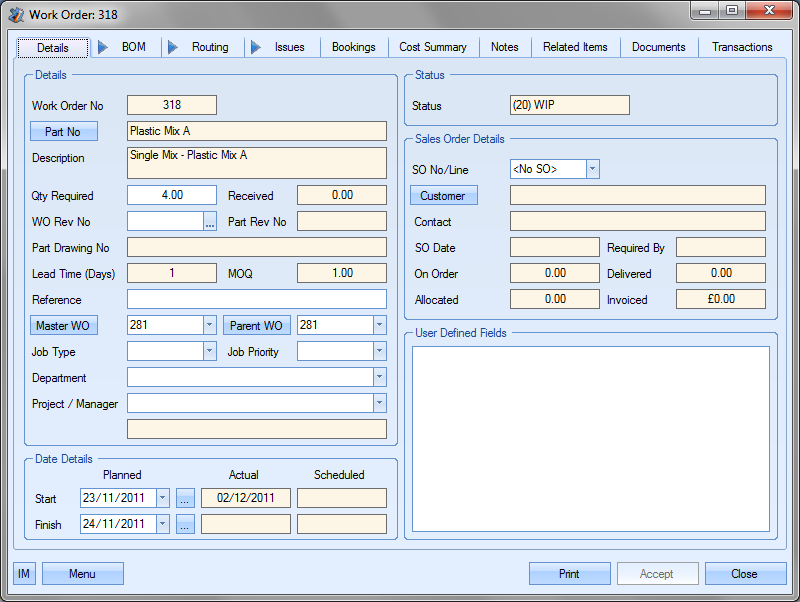
Clicking either the Accept or Close button will return the user to the Today screen.
WO With All Material Issued Not Yet Started
This option displays WOs where all required material has been issued to the WO, but no labour booking have been made.
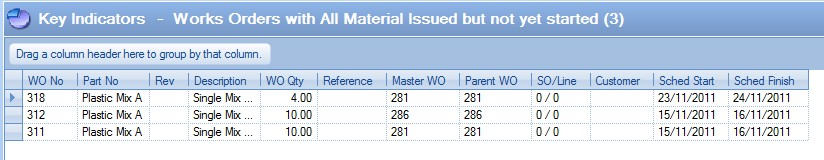
To view all the information contained for a works order the user may simply ‘double click’ on the required line. A screen similar to the following will be displayed.

Clicking either the Accept or Close button will return the user to the Today screen.
This option permits the user to view the performance rate for deliveries raised in the last certain number of days as chosen by the user in the Period: Last X Days field at the bottom of this screen and not the Due No Days option on the main form.
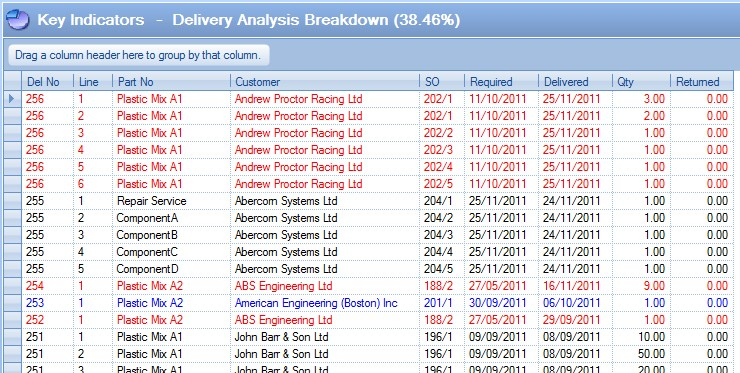
Delivery line items are displayed in red for items that have been delivered late and black for items delivered on time or early.
The number of deliveries raised within the selected time period will be displayed along with the corresponding performance rate (% on time or earlier) and (% late) for the number of days selected.
The user may also if desired choose to view the performance of deliveries made within a specified number of days of the sales order required date. This is set using the % Within X Days value.
![]()
By selecting a % Within X Days value, as shown above, items that were delivered late but within the specified number of days of when they were due will be displayed in blue as shown in the screen above. In the above example, Progress has calculated that approximately 46% of deliveries in the last 60 days have been made on time, earlier or within 20 days of when they were due to be delivered.
To view all the information contained for a delivery shown, the user may simply ‘double click’ on the required line. A screen similar to the following will be displayed.
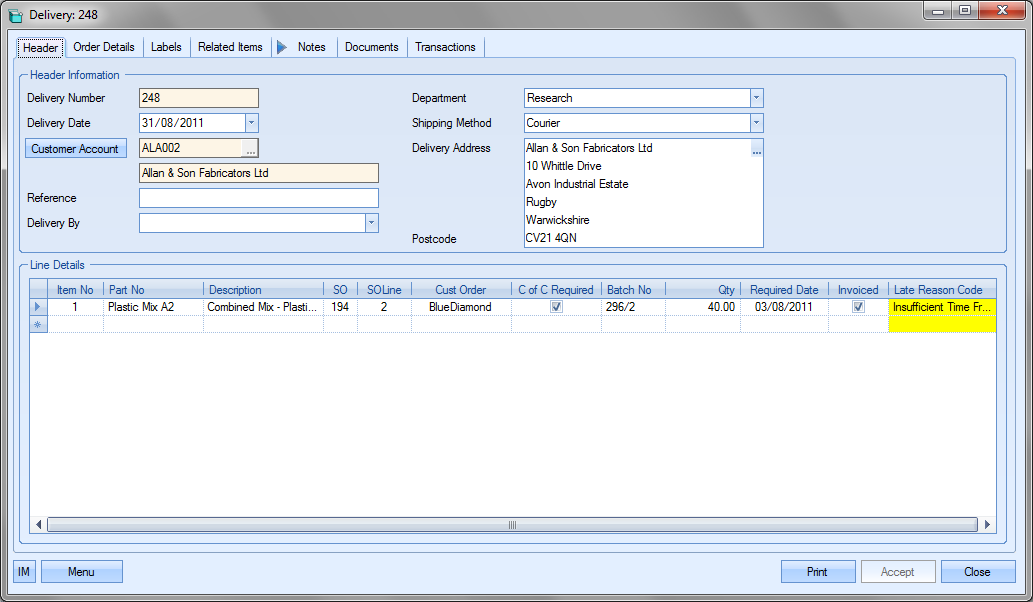
The user may if required change certain information contained on this enquiry if he or she has permission to do so as determined within the User Access Rights section of the Security section of Progress. For more information on amending enquiries please refer to the Delivery section of this manual.
Clicking either the Accept or Close button will return the user to the Today screen.
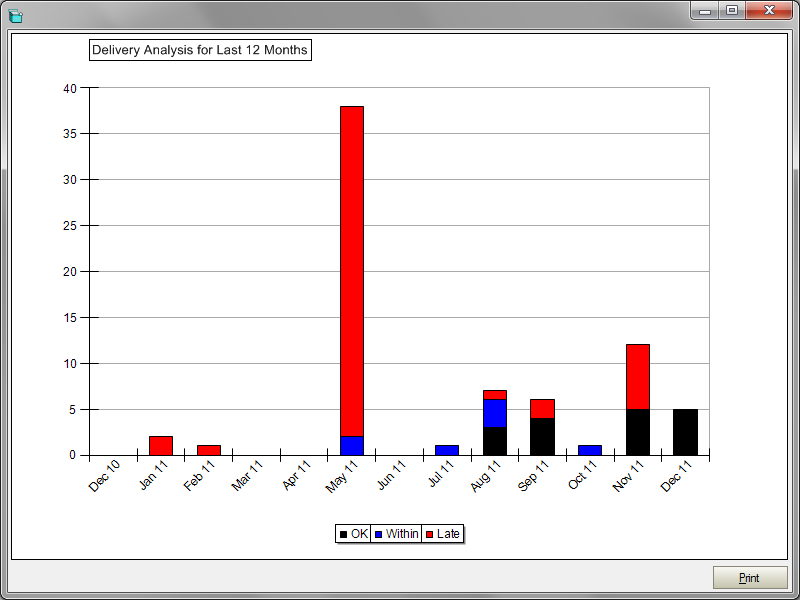
The user may also click onto the Graph button to view a graphical representation of the information and also view analysis for the previous 11 months.
This option permits the user to view all sales invoices and credits raised within the current calendar month.
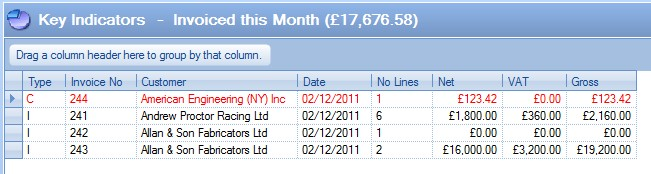
Credits are displayed in red and invoices are displayed in black as shown in the screenshot above.
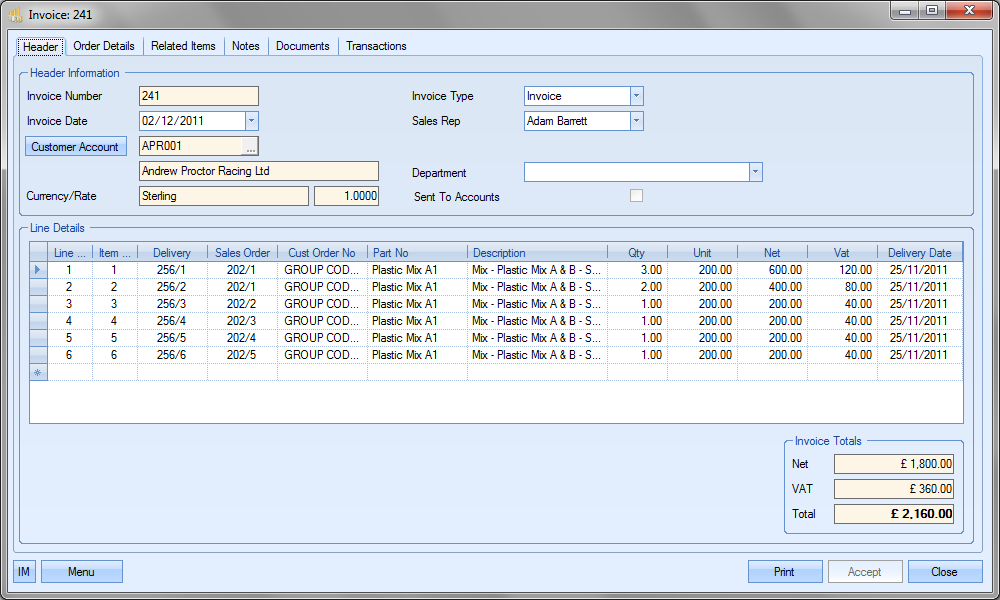
To view all the information contained for a invoice or credit shown, the user may simply ‘double click’ on the required line. The selected invoice or credit will be displayed.
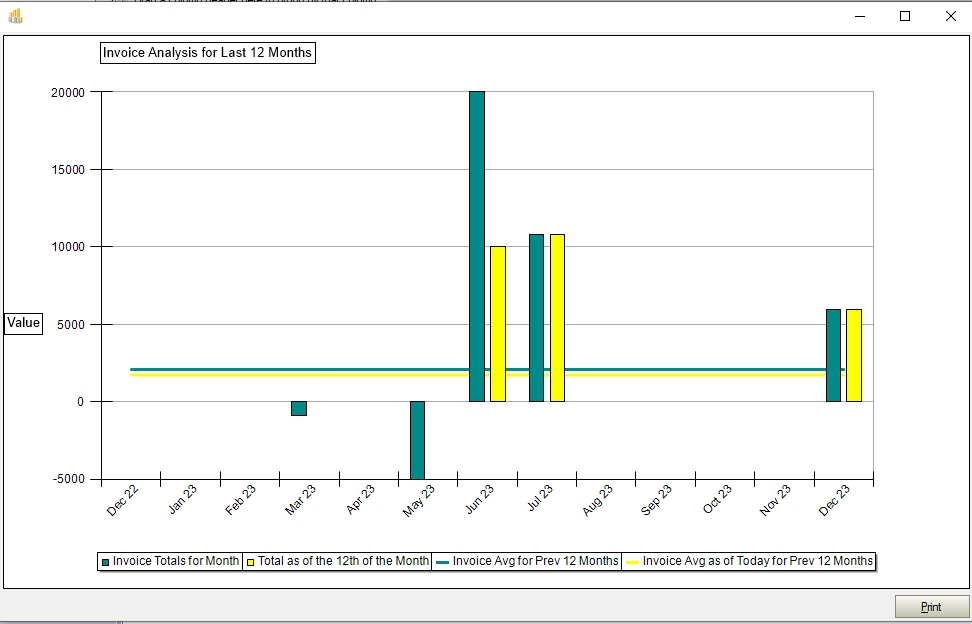
The user can also view a graph of the total invoice values for the last 12 months, and averages, by clicking on the GRAPH option at the bottom of the screen. A graph similar to the following will be displayed.
Holidays
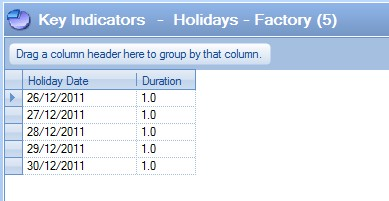
The three key indicator options listed on the Today screen permit the user to view all holidays currently set up in the Progress calendar that fall within the period specified by the Due No. of Days value set on the Today screen. Each of the options shows the different holiday types that can be recorded.
This lists any holiday dates and durations, that are planned for the whole factory within the period specified. This would include public holidays and factory shutdowns.
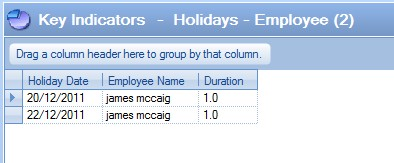
This option lists any holiday dates and durations that are planned for individual employees within the period specified.
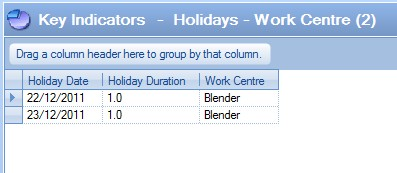
Lists any holiday date or shutdown and durations that are planned for Work Centres in the factory within the period specified. This would include scheduled maintenance.
For more information on recording and maintaining holidays for employees, work centres and factory-wide holidays, please refer to the Maintenance > Holidays section on this manual.
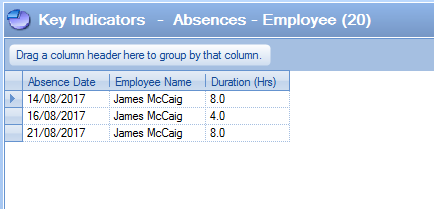
Absences - Employees
This screen shows the number of upcoming absence hours based on recorded absences in the T&A section of Progress.
For more information on recording and maintaining absences for employees, please refer to the T&A section of the manual.