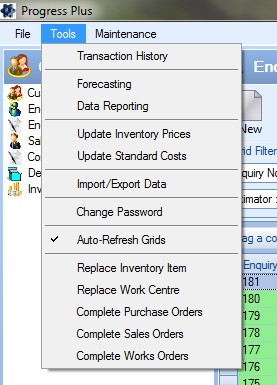
This tool in Progress allows the user to create data queries and reports which may not be standard within the Progress reporting section. This tool is accessible from within the TOOLS menu at the top of the main Progress window.
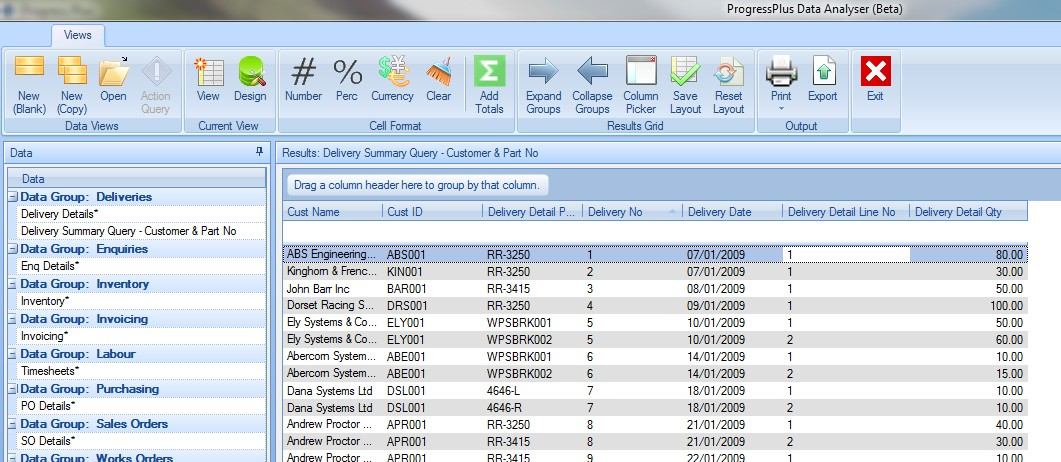
Once selected, the user is presented with the main Data Reporting window as shown below.
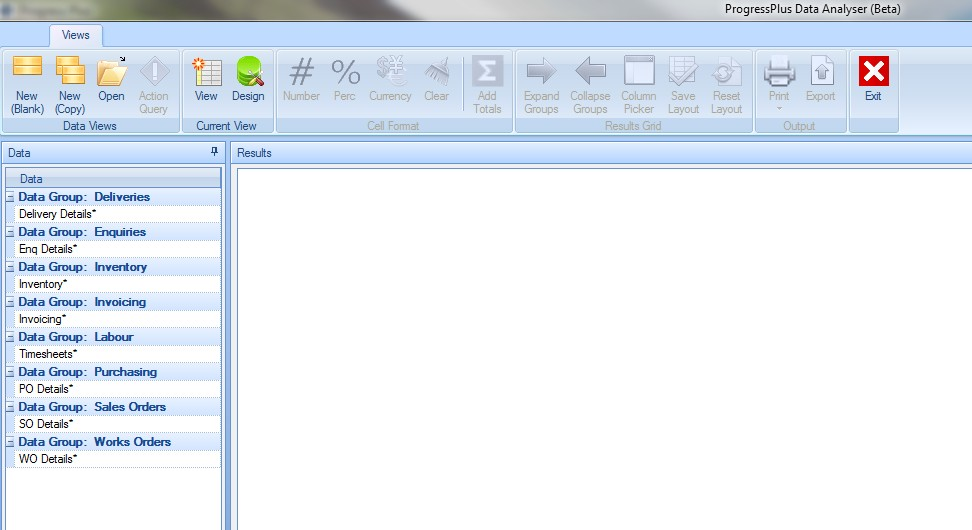
The main screen is split into three main sections:
Menu options
The menu options across the top provide the user with options to create, copy and design the data queries as well as provide some data formatting and printing options for the queries created.

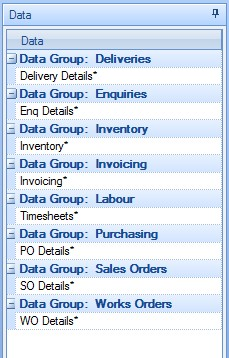
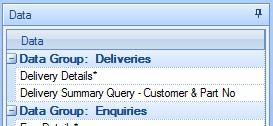
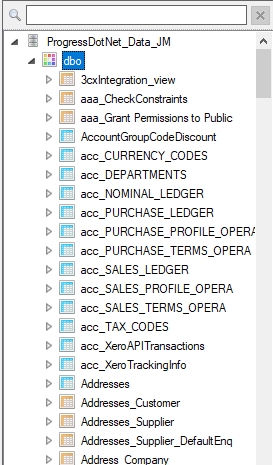
Data
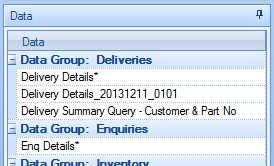
The data section shows the all queries that are available. Initially, there are only the system default queries (marked with an asterisk), but additional queries will be added to the categories as the users create them.
Results
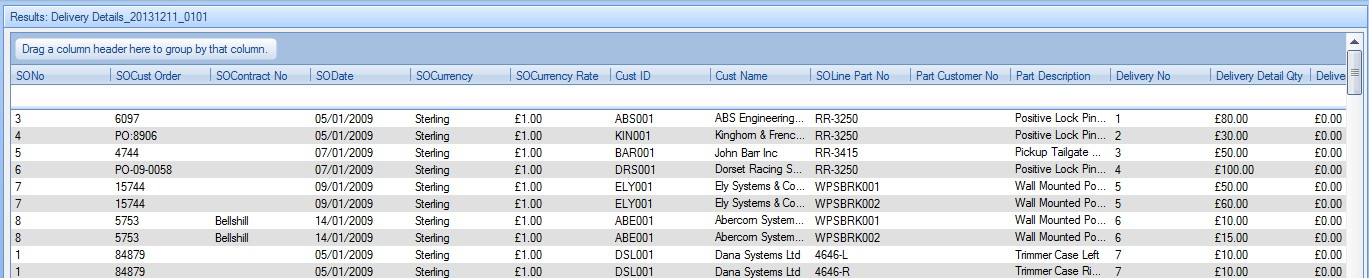
The result section displays the results of the selected query. The user can group and filter the results on this section as well as amend the formatting and layout of the data to suit their requirements.
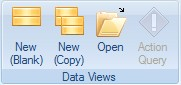
Creating New Queries
To create a new query, the user has a couple of options; create a blank query or make a copy of an existing query. These options are available from the menu options at the top.
New Blank Queries
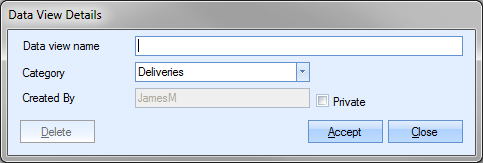
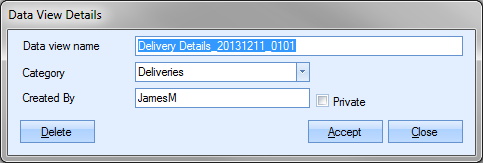
Selecting the NEW (BLANK) option prompts the user for a name for the query. The user can also select the category this wish to add it to and also whether the query is hidden from other users (PRIVATE option).
This will add the query to the Data section on the left hand side.
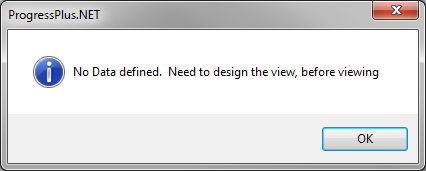
Since this is a blank query, no data information has been specified yet, so highlighting the query in the data section present the following message.
The next stage is to select the data required from the data using the DESIGN menu option. This option will be covered later on in this document.
Copying Existing Queries
The user can copy an existing query using the NEW (COPY) menu option. To copy an existing query, the user simply highlights the query they wish to copy in the Data section and then click the NEW (COPY) option. The user will be prompted to provide a name for the new query as well as the option to select the category it will place in.
Clicking the ACCEPT will save the copied query into the selected category and display it in the Data section.
Clicking on the query in the Data section will populate the Results section with the results of the query.
Amending/Deleting Queries
Existing queries can be amended or deleted by highlighting them in the Data section and selecting the OPEN menu option. This will display the details for the user.
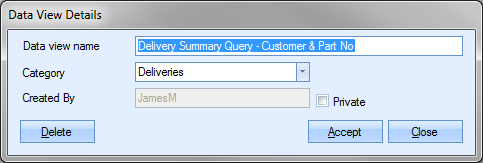
The user can amend the name or category from here and click ACCEPT to save the changes or they can click the DELETE option to remove the query altogether. Deletion will remove the query from the Data section completely.
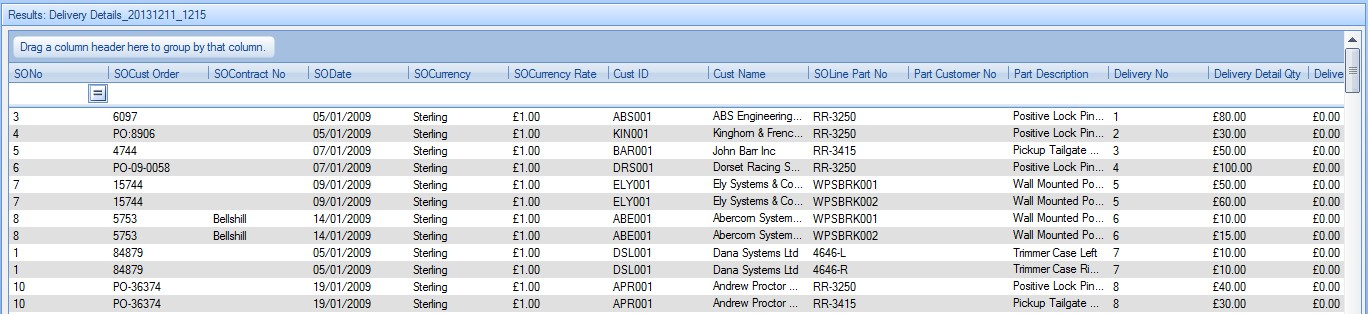
Viewing Query Results
Existing queries can be run using the VIEW menu option.
![]()
This will run the existing query and display the results in the Results section of the screen.

Designing Queries
Once a query has been created, whether copied or created blank, the user can design the query to meet their data requirements. The design screen is accessible by highlighting the query the user wishes to design and then clicking on the DESIGN menu option.
![]()
This will present the user with the Query Design screen.
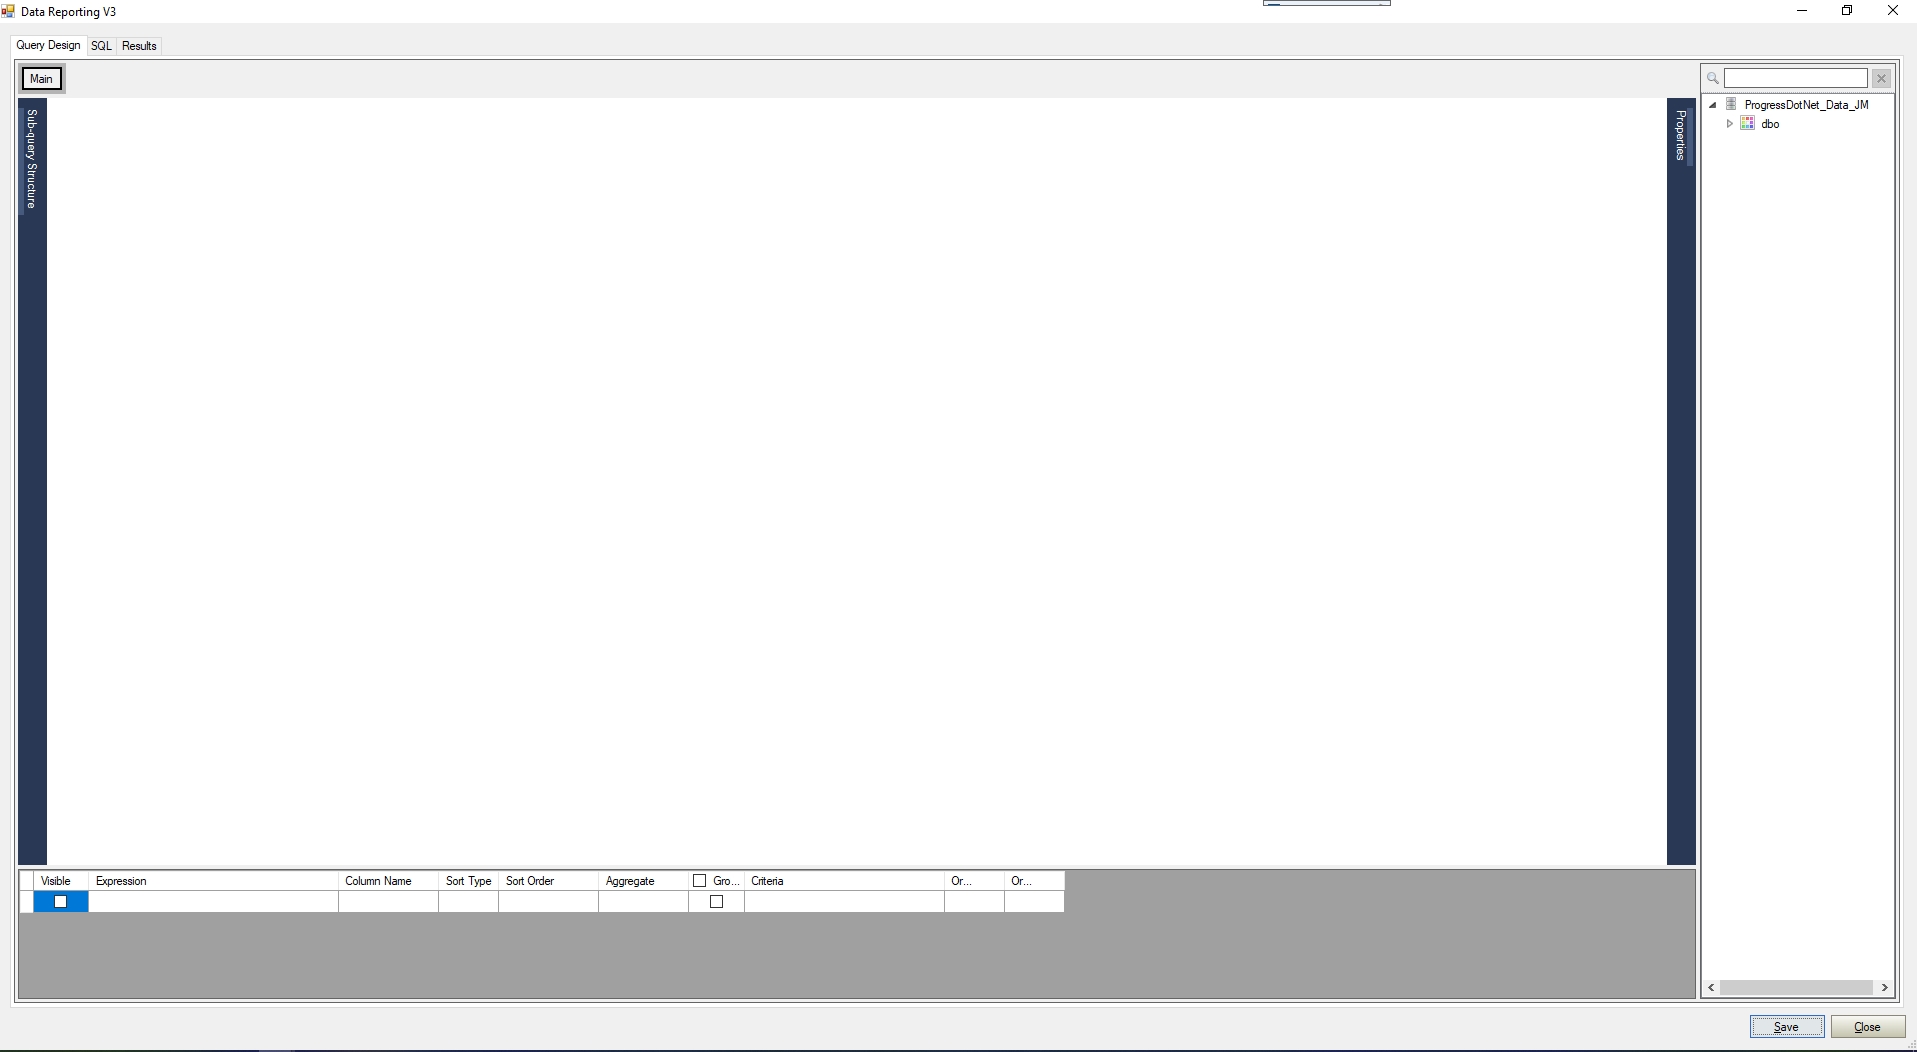
The Query Design screen consists of the following sections:
Field Selection
This section shows the fields that have been selected for the query, as well as any formulae, filters or sorting options that may be used.
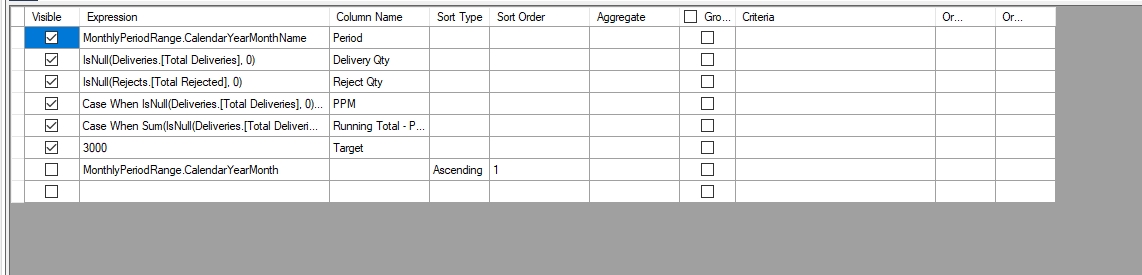
Field names and formulae are listed under the EXPRESSION column. The COLUMN NAME allows the user to give the column a specific label. SORT TYPE/SORT ORDER allows the user to sequence the data in the way they want. The AGGREGATE column allows the user to apply aggregate functions to their query (i.e. SUM, AVERAGE, COUNT, etc.). The CRITERIA column is where any filters are applied (i.e. Part Number = 'Part X', etc.).
Visual Designer
This section shows a diagram of the tables currently selected for the query and also any links that exist between tables if multiple tables are being used.
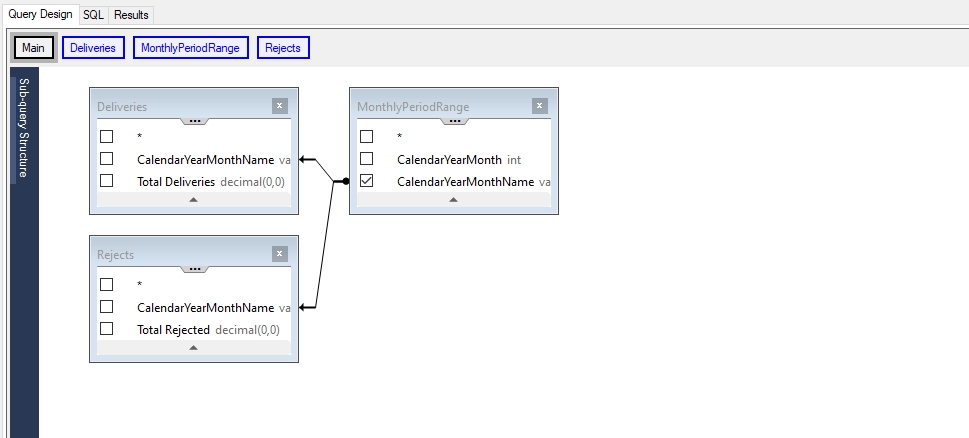
This section can be used to link the table fields together as well as allow the user to “tick” the fields they wish to include in their query results. As fields are ticked for inclusion, the other sections of this screen are updated accordingly to reflect the changes made by the user.
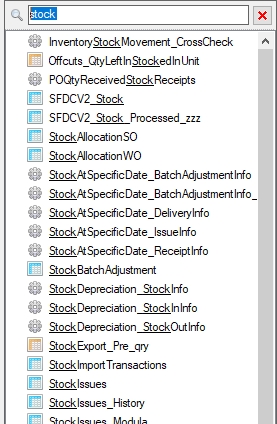
Data Tables
This section of the Query Design screen shows a full list of all the data tables held in the Progress database. These are the main database tables used by Progress to hold all the data.
Each data table listed can be expanded to see the names of the fields included in each table. The data tables listed can also be dragged across into the Visual Designer section, or double-clicked, to add them to the query. The SEARCH box at the top of the list can be used to search for tables/functions in the database.
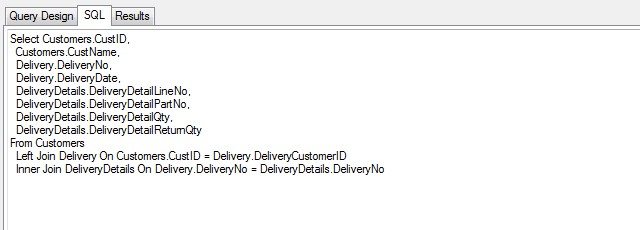
SQL
The SQL tab shows the full SQL text for the query they have designed using the Query Design section. If the user is more familiar with writing their SQL using this method, they can enter it directly into this screen to create the query.
Results
The RESULTS tab shows the current results of the user’s query. This can help the user build their query step-by-step to ensure that each change they make to their query is correct and generating the results they require.
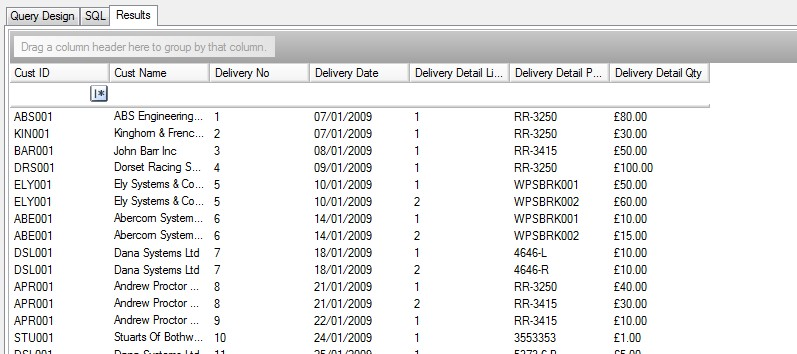
The user can also use the filters at the top of the columns to filter the result set further; however, these filters do not update the SQL or Query Design tabs.
Once the user has compiled their query, they can save their query using the SAVE option at the bottom of the screen. From this point on, the user can run their query from the main Data Reporting screen by simply highlighting the query name in the Data section and clicking the VIEW menu option as previously described.

Running Existing Queries
The user can run their query from the main Data Reporting screen by simply highlighting the query name in the Data section and clicking the VIEW menu option as previously described. This will display the result of the query in the Results section.
The user can use the options at the top of the screen to format, group and sort the data as per their requirements.
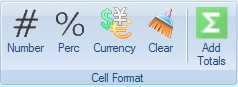
Formatting Options
These tools allow the user to specify the formatting of the selected field.
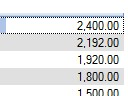
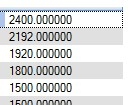
The NUMBER option formats the highlighted field as a number. This will display the number to two decimal places and right-justify the data in the field.
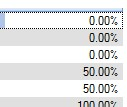
The PERC option formats the field as a percentage. All decimal fields would subsequently show as a percentage.
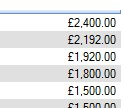
The CURRENCY option formats the value with a currency symbol and to two decimal places.
The CLEAR option removed all formatting from the selected field.
The ADD TOTALS allows the user to add totals against the selected field. If no grouping is being done on the results, then this will simply be a total of the selected field over the full result set. If groupings have been made, then the totals will appear after each group as well as at the end of the result set.
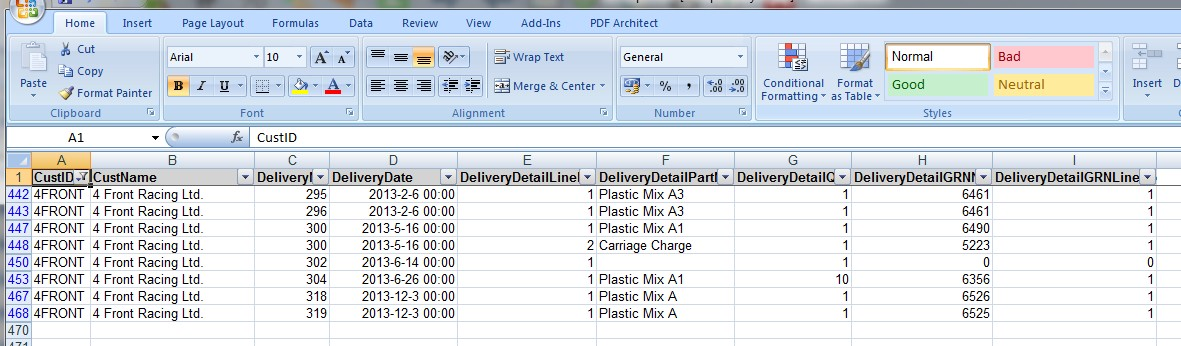
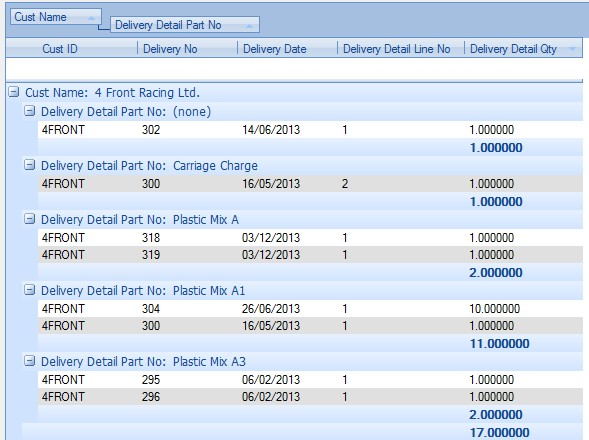
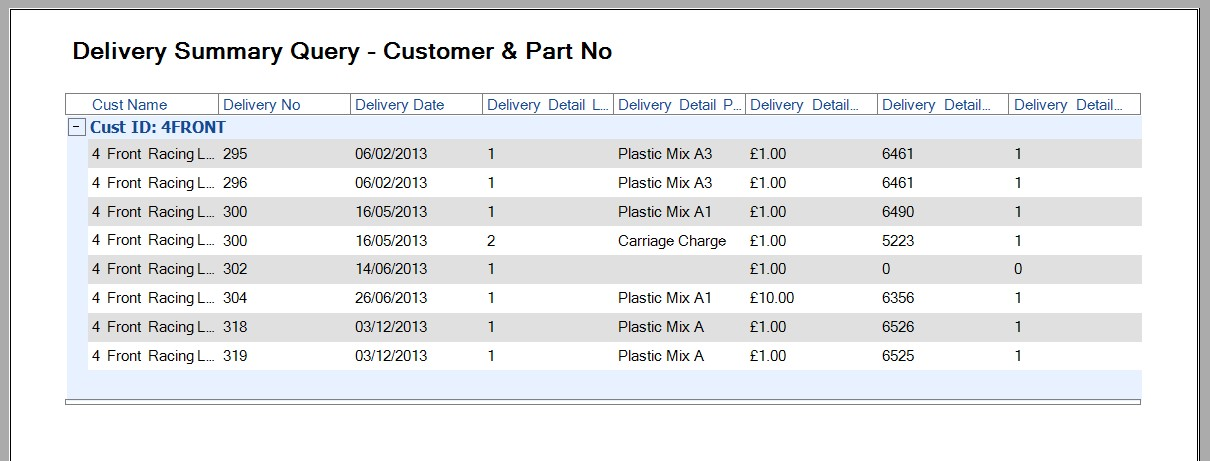
The screen below shows some totals added against groupings. The results in this example have been grouped by customer and then part number, so totals have been added for both. This gives delivery totals for each part number and also a total delivery quantity for the customer.
Results Options
The results section has some options available to the user too. These allow the user to save specific layouts of the data, choose the columns they wish to see amongst other things.
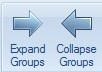
The EXPAND GROUPS and COLLAPSE GROUPS options do exactly what they say. Where groups have been set against the results, the user can quickly expand or collapse the selected group to show or hide the lower level detail.
The example below shows a result set grouped by customer.
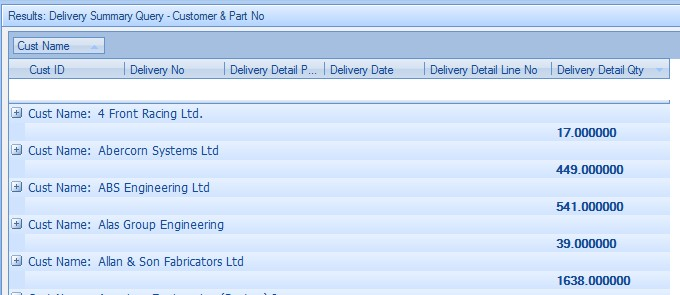
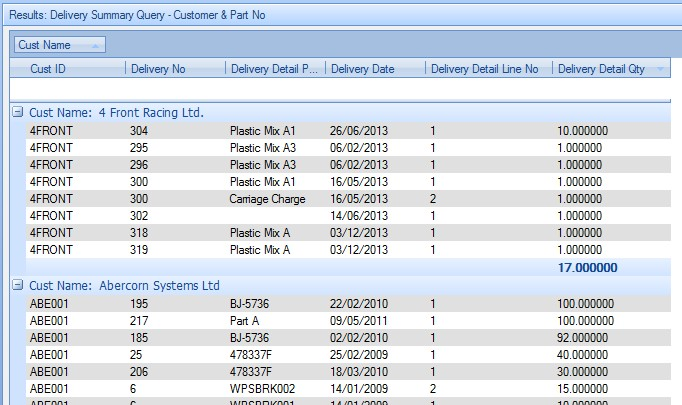
Selecting the group and clicking the EXPAND GROUPS option results in the lower level detail being displayed.
Selecting the group and clicking the COLLAPSE GROUPS option returns the data set to its initial summarised form. Where multiple groups have been selected, the user can have a mixture of expanded and collapsed groups.
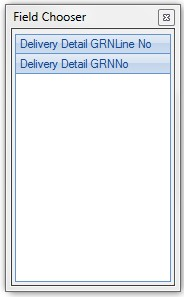
The COLUMN PICKER option allows the user to decide which columns they wish to see or hide within the Results section. By default, the data results will include all fields from the query. Clicking on the COLUMN PICKER option opens a little box that the user can drag fields from/to depending on whether they wish to include them in the results.
The SAVE LAYOUT option allows the user to save the query layout. This will record the column sequences, sorting and any totals or groupings that the user has added. NOTE: This is not a user specific version of the query and will update the query for everyone who may use it. If different versions of the query are required, then alternative queries should be created.
The RESET LAYOUT option allows the user to reset all changes to the result set back to the default query results layout. NOTE: This removes all SAVED changes too.
Query Outputs
Once the user has identified the data they want, they can either print the results or export them to Excel for further analysis.

The PRINT option allows the user to decide whether to print either portrait or landscape before presenting the user with a preview screen of the report to be printed.
Alternatively, the user can export to Excel using the EXPORT option. This presents the user with a prompt for a filename before generating the spreadsheet with the data and opening it up for the user to view.