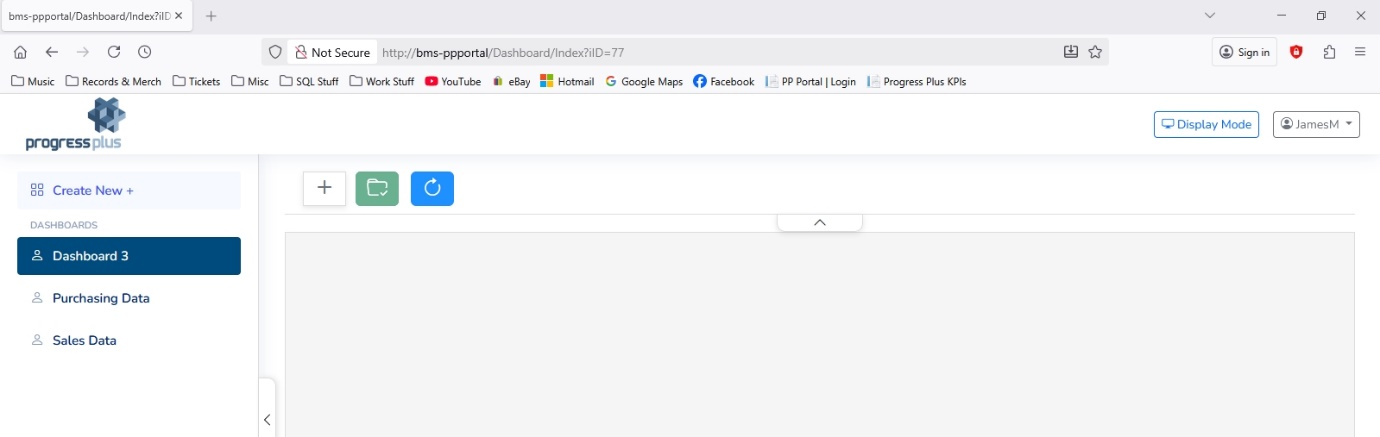
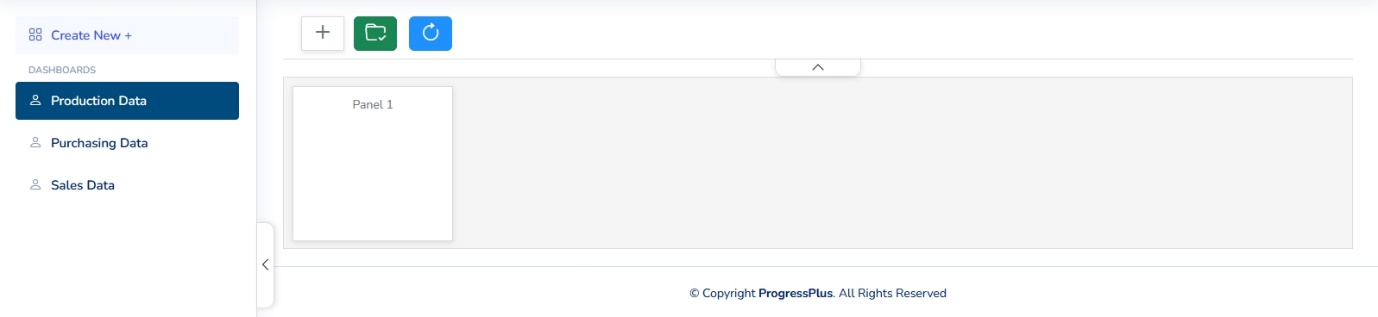
Once the user logs into the KPI page, they will be presented with the main KPI Dashboard section. This screen allows the user to create, edit, view and cycle the dashboards which have been set up for use.
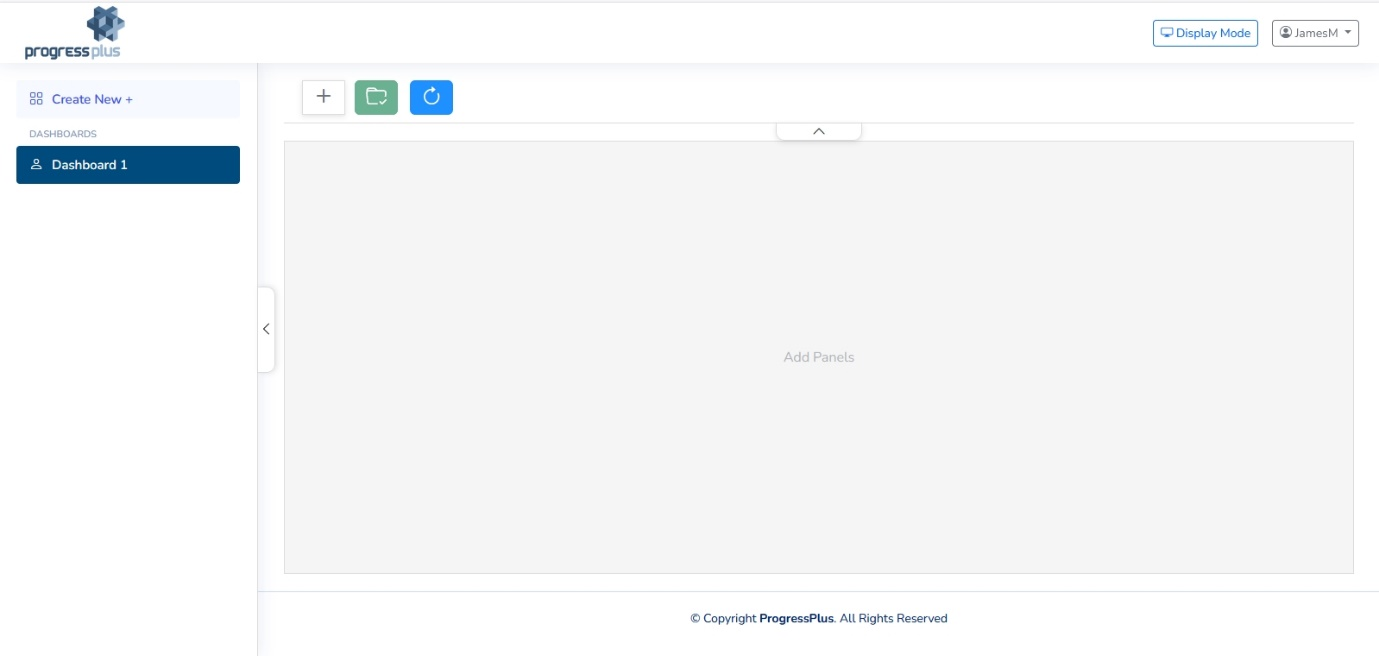
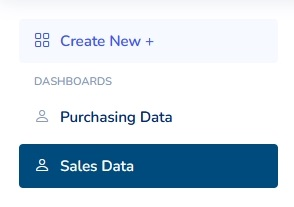
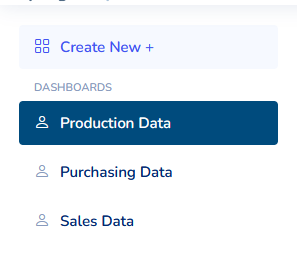
On the left-hand side of the screen is a list of all existing dashboards, as well as the option to create new dashboards.
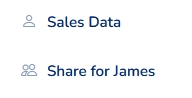
If the user has created the dashboard, then a single user icon will be displayed against the dashboard. If the dashboard shows multiple user icon against it, then this is a dashboard that has been shared with the user, and not one they can edit.
The main section of the screen is where the selected dashboard details are shown.
Viewing Existing Dashboards
The user can view an existing dashboard(s) by clicking the DISPLAY MODE option at the top of the screen.
Clicking this option will present the user with the display/slideshow settings.
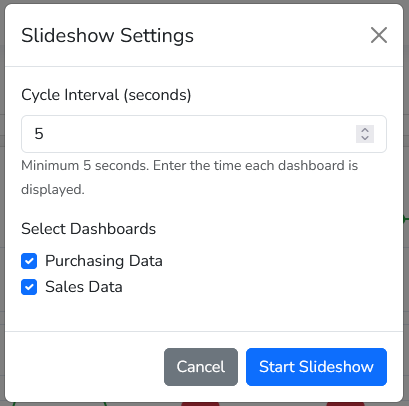
From here, the user can select the dashboard(s) to be shown and the cycle interval between each element. The user can select one or more dashboards to be displayed/cycled through from the list at the bottom. Once done, they can click the START SLIDESHOW option to start the display. This will display the selected dashboard(s) full screen and for the specified amount of time.
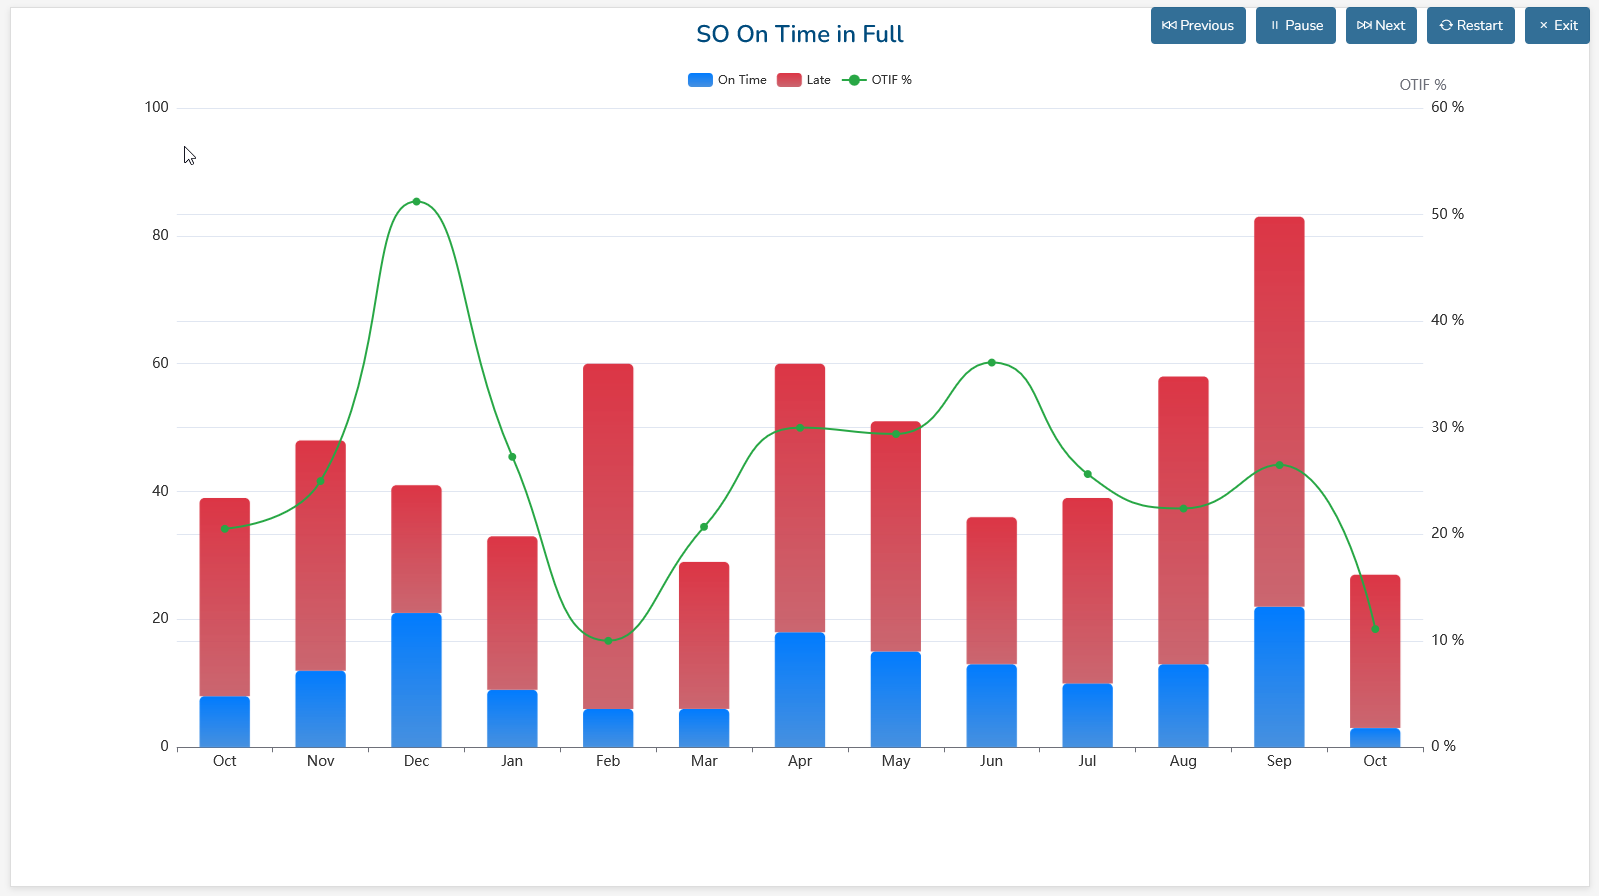
The user will have some onscreen options available allowing them to cycle manually through the selected dashboard screens, as well as the ability to pause the slideshow at the current screen (useful if the dashboard screens are being discussed), restart and exit.
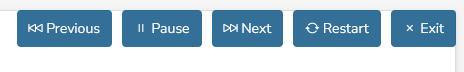
Clicking the EXIT option will return the user to the main dashboard screen.
Creating New Dashboards
The user can create new dashboards from the main dashboard screen using the CREATE NEW + option at the top-left corner of the screen.
Clicking this option adds a new dashboard to the list on the left and blanks the main section of the screen.
Editing Dashboard Settings
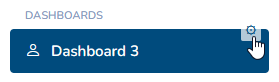
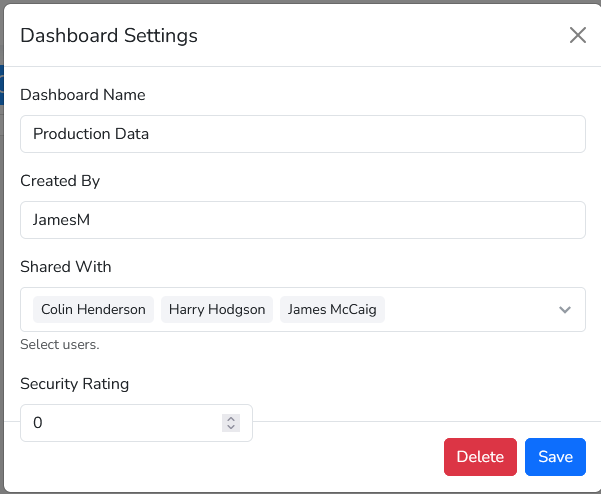
Once a new dashboard is created, or if the user wishes to edit an existing dashboard, the user can edit the dashboard settings to rename the dashboard, assign security levels and set who the dashboard is available to, all of which can be accessed via the “wheel” option against the dashboard name.

Clicking this option presents the user with the following settings which they can amend the name of the dashboard, who can access the dashboard and any associated security rating. They can also delete the dashboard if required. For more info on the security settings, please refer to the KPI Security section.
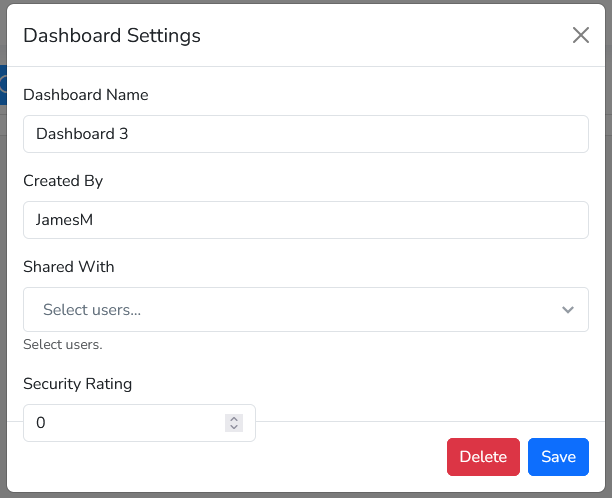
Once the user has made any changes, clicking SAVE will save the changes.
Once saved, the new dashboard will be listed on the left-hand side of the screen along with the others.
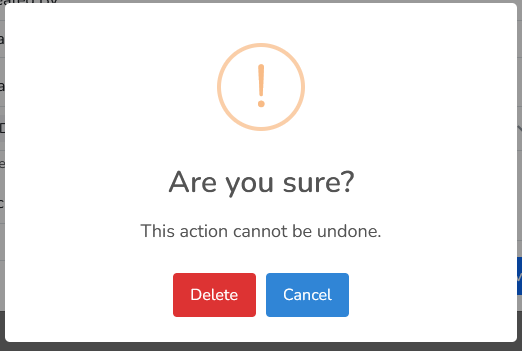
If the user wishes to delete the dashboard, they can click the DELETE option. This will prompt the user to confirm before deleting the dashboard from the list on the left-hand side.
Editing Dashboard Panels
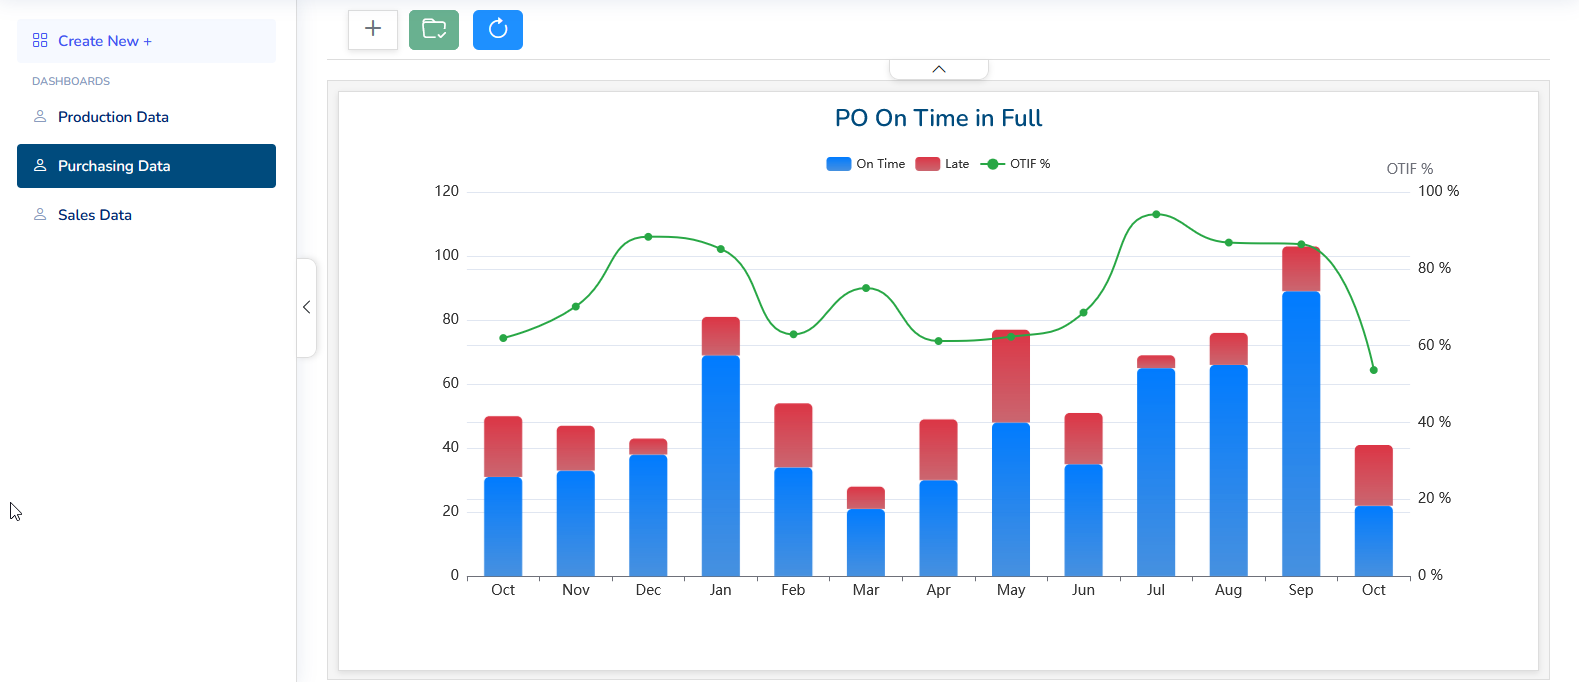
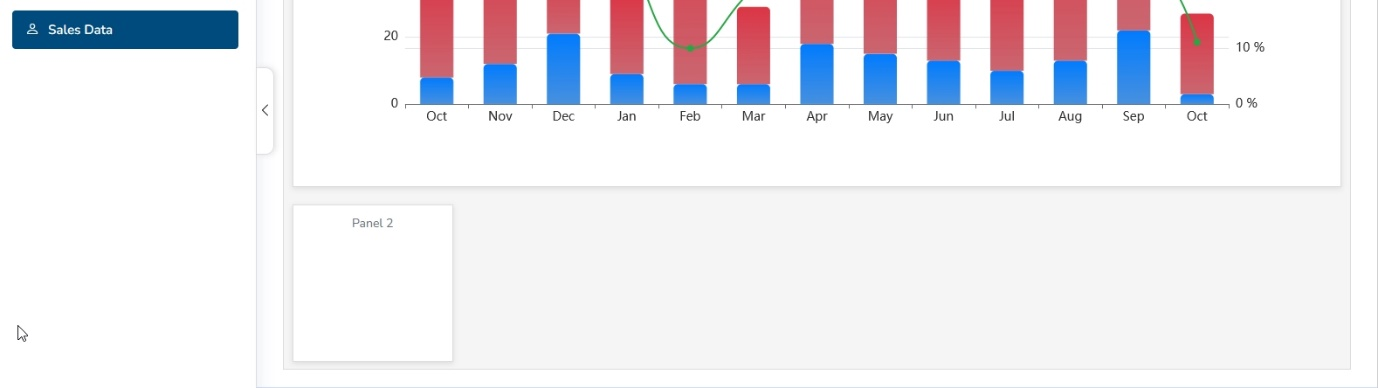
Once a new dashboard has been created, or if the user wishes to edit the contents of an existing dashboard, the user can use the main section of the screen to add, edit and/or remove the different “panels” of information that are included in each dashboard.
When the user selects the dashboard in question, the main section of the screen will show either a blank screen (if the dashboard is new) or will show existing “panels” of the dashboard.
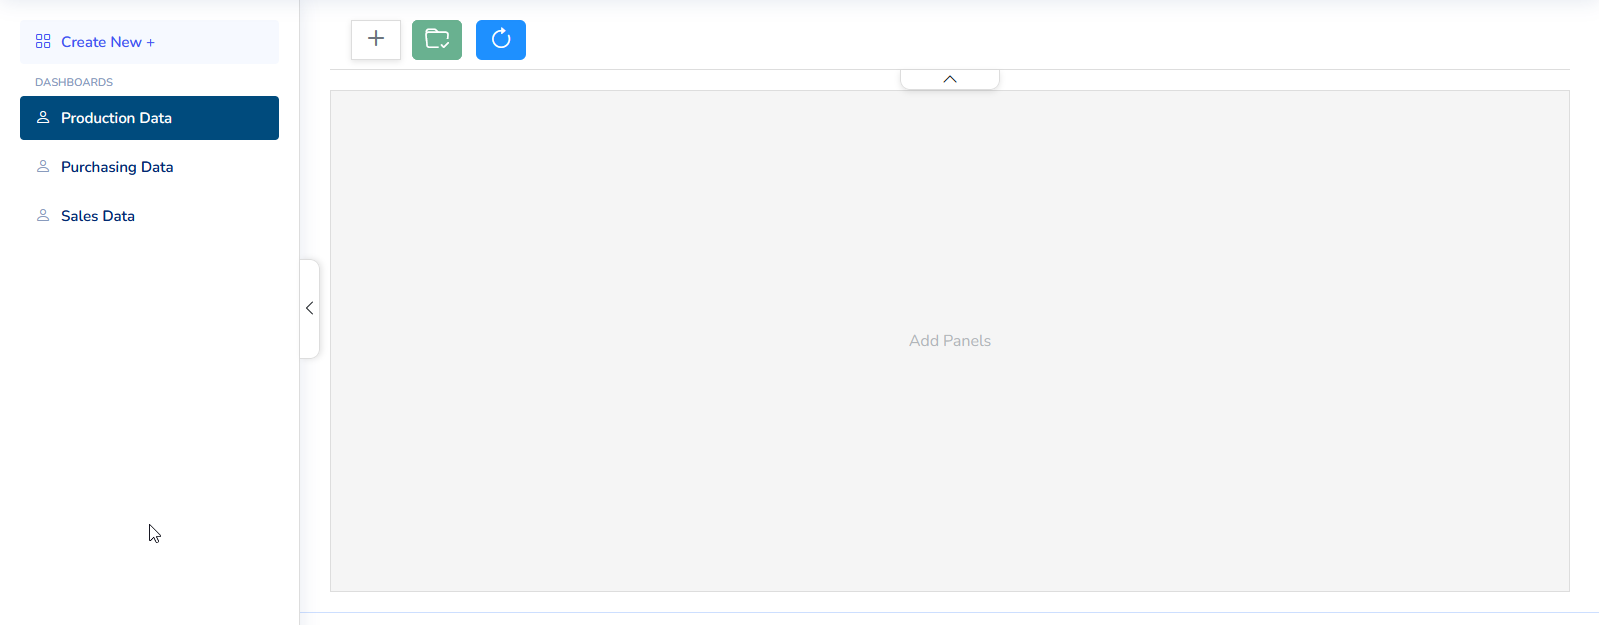
(New dashboard)
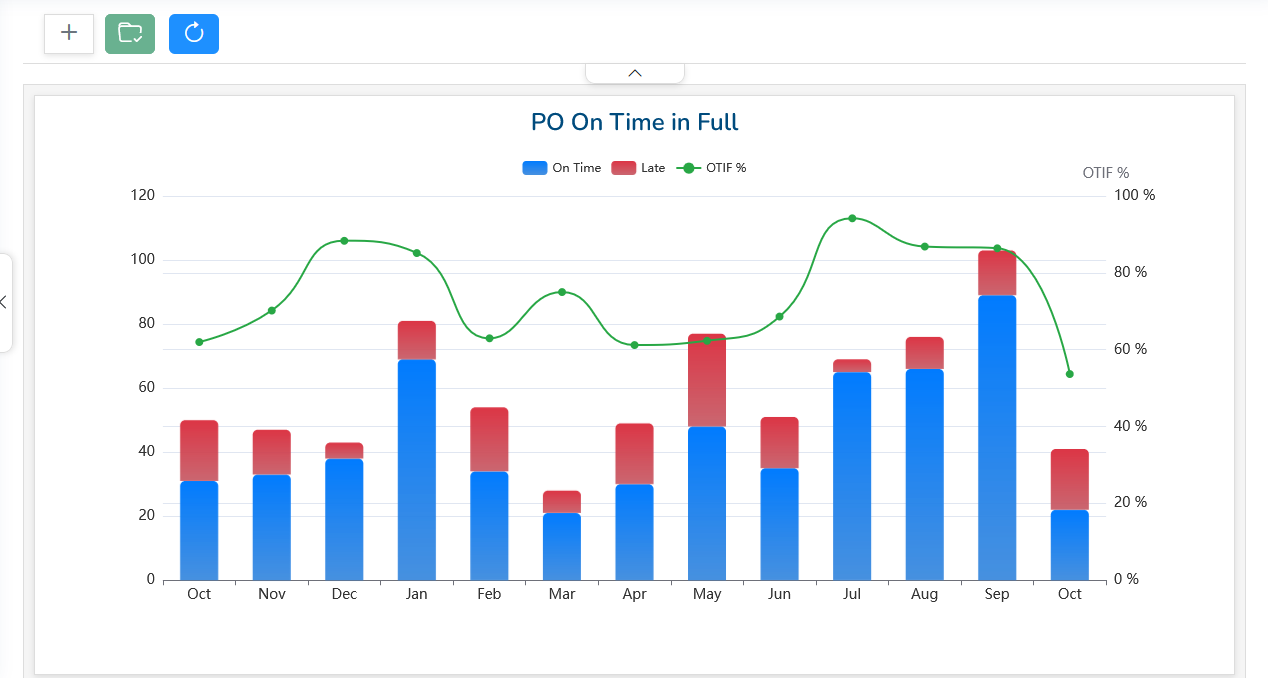
(Existing dashboard)
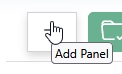
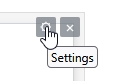
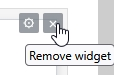
The user can add additional “panels” of information using the “+” icon at the top of the screen or edit the contents of existing panels via the “wheel” on the panel itself. The user can also delete existing panels from the dashboards from here too.
Adding Panels
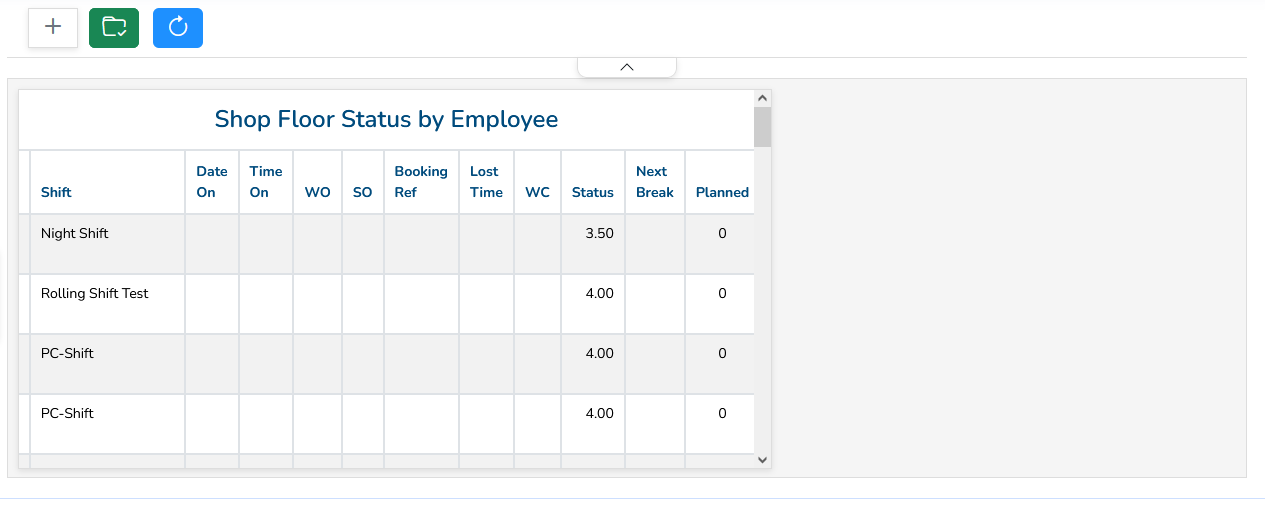
Clicking the ADD PANELS option will add a blank panel to the dashboard for the user to set up. New dashboards will have “Panel1” added while existing dashboards will have the next sequential panel added.
(New panel on a new dashboard)
(New panel on an existing dashboard)
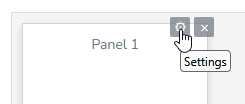
Once a new panel has been created, or if the user wishes to change the info on an existing panel, the user can do this via the panel settings which can be accessed via the “wheel” icon on the panel. Similarly, existing panels in existing dashboards are edited in the same way.
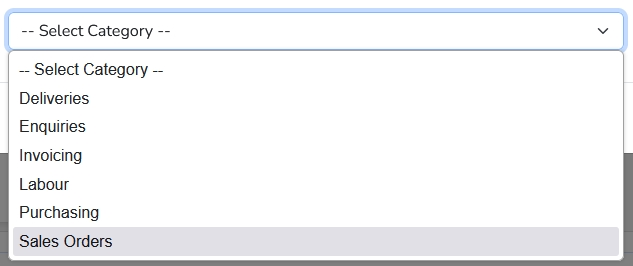
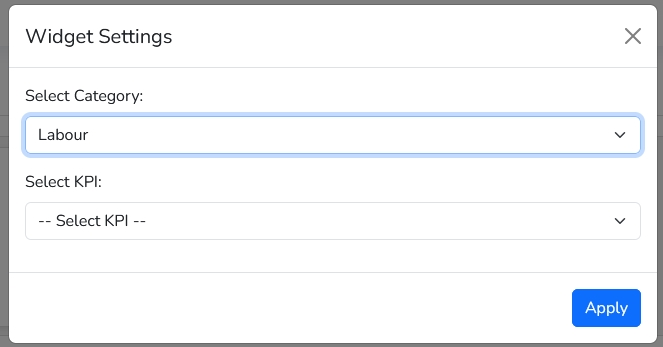
When selected, the user is prompted to select a category. This is the area of the system that the information will be coming from.
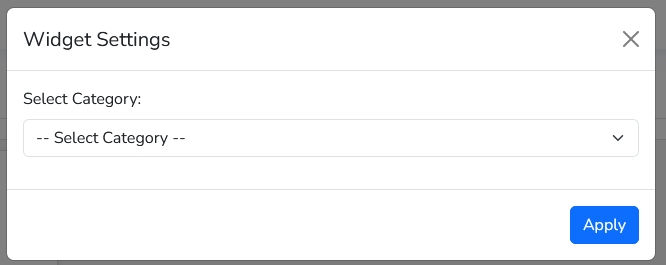
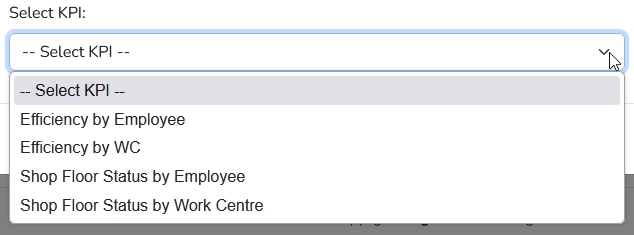
Once the user has selected the category, they can select the KPI they wish to display on the panel.
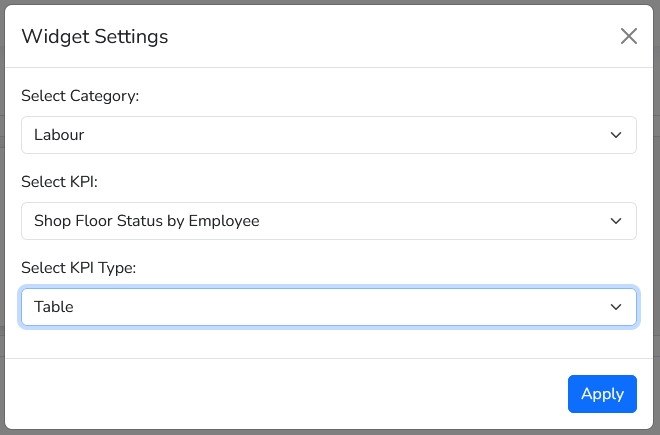
Once the KPI has been selected, the user can select the KPI type. This will in most cases be pre-set, but allows the user to see the information in a tabular or chart method depending on how the KPI has been set up for use.
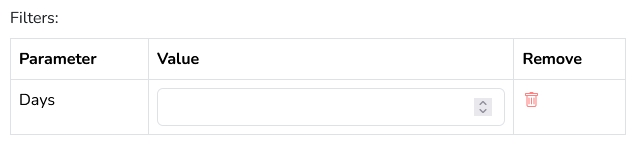
If the selected KPI has parameters/filters associated with it (i.e. date range, X number of days, etc.) then the user will be prompted to enter this information for the KPI to run.
Once all the details have been entered, clicking the APPLY option will generate the panel with the selected KPI.
If the user wishes to add further panels, they can repeat the process above for each additional panel they wish to add to the dashboard.
Once done, the user can save the changes made using the SAVE option at the top of the screen. This saves any changes to the panels and formatting made by the user.

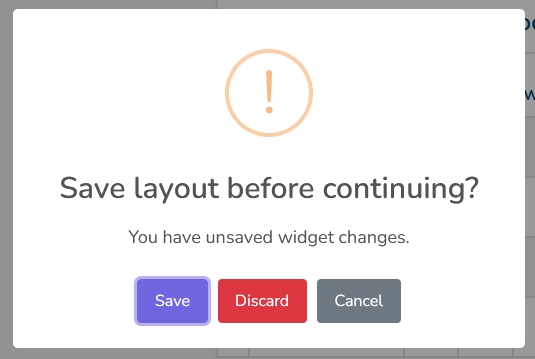
If the user tries to exit the dashboard without saving the changes, the system will prompt the user to save them.
Formatting Dashboards
As well as selecting the KPIs they wish to add to each dashboard, the user can also arrange how they are displayed. This is particularly useful when the dashboard contains multiple panels.
The user can drag the panels about to place them in specific sections of the dashboard and resize them using the arrow/resize option in the bottom-right corner of the panel.

Dashboards with multiple panels will display them all onscreen as per the user’s layout with the slideshow arranging them as required to make them fit.
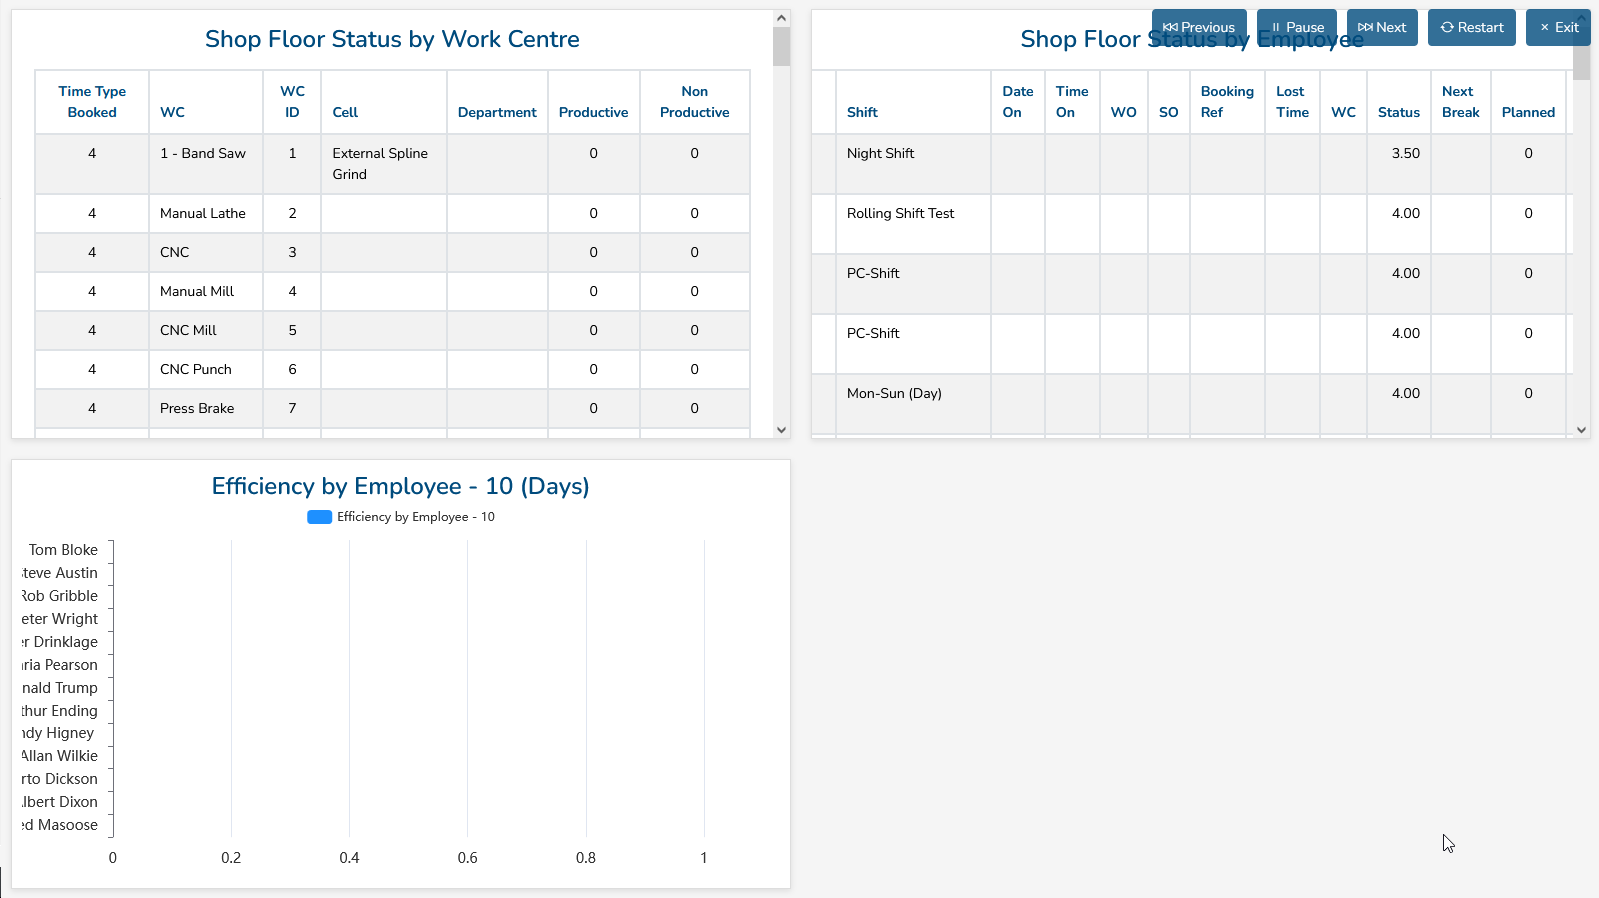
(3 panel dashboard example)
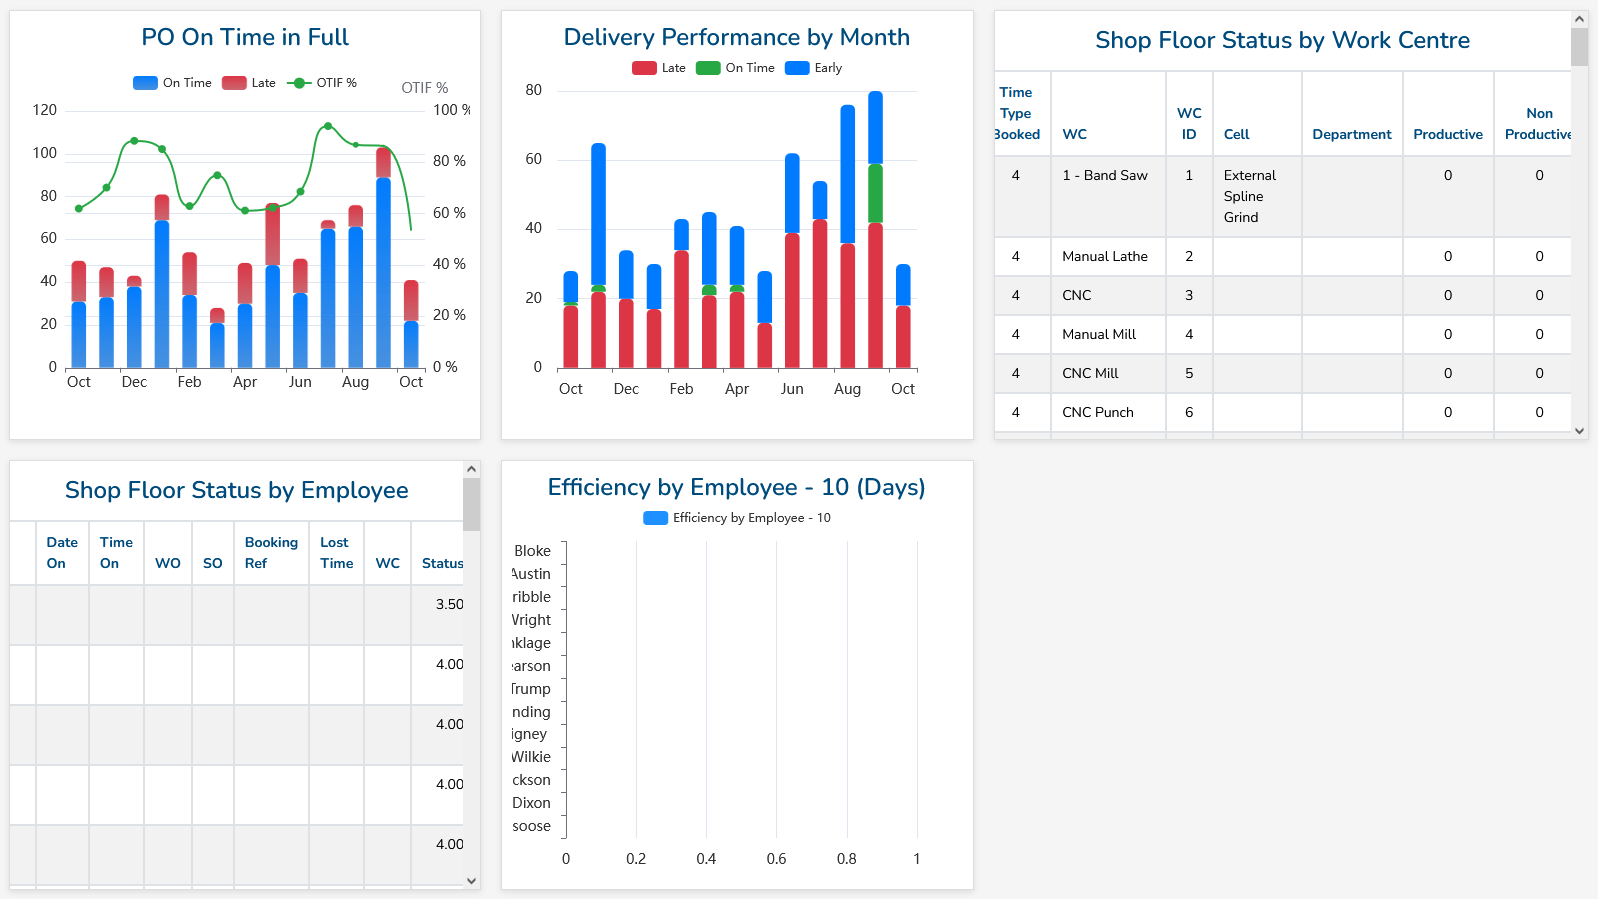
(5 panel dashboard example)
Once done, the user can save the changes made using the SAVE option at the top of the screen. This saves any changes to the panels and formatting made by the user.

If the user tries to exit the dashboard without saving the changes, the system will prompt the user to save them.

KPI Security
The KPI module also has a level of security that can be used to restrict the contents of the dashboards. The available KPIs can have their own security level, which is then compared to individual users KPI security rating to see whether that user is able to view the KPI in the dashboards.
The dashboard security levels are calculated based on the content of the panels within it. New dashboards will be created with an initial security level of zero, but as the user starts to add panels, the security level will be calculated based on the highest security level of all the panels included.
The individual KPI security levels are set in the Admin section of Progress, under the RPT ACCESS screen (shown below) with the user’s security level set in the user permissions screen.

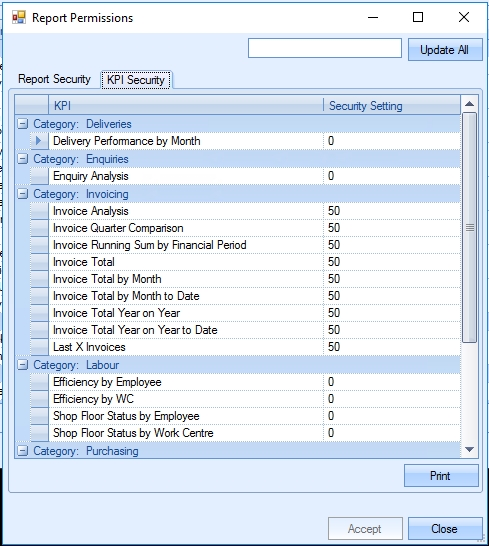
(KPI security ratings)

![]()
(User access rights - KPI security level)
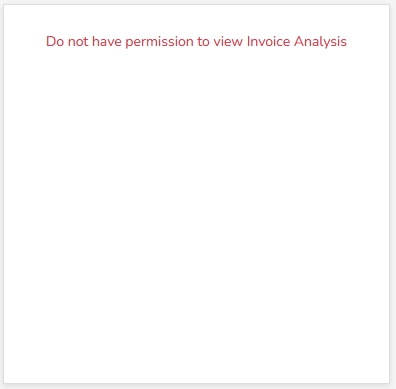
If a user is viewing a panel in the KPI module which they are not authorised to see, the user will see the following on screen when that panel is displayed both in the dashboard design section and in the slideshow.
For more information on setting up KPI security and user access levels, please refer to the Administrator Functions section of the manual.